
Market Climate Indicator
School 06 — Market Climate Lab
School 6 · Market Climate Lab · About 15 minutes
Every investor needs a weather report. A sailor checks the sky before leaving harbor; an investor should check the market's climate before putting money to work. The Market Climate Indicator is Luke's own framework for reading that weather — built from years of his own research into what actually moves markets: earnings. It lives on the Academy's free Market Climate Dashboard, and this class teaches you to read it: the three lights, the five charts, the fear gauge, and what it all means for how you manage risk. This is education, not financial advice — think of the dashboard as a weather report, not a recommendation to buy, sell, or hold anything.
Weather, Not Fortune-Telling
The dashboard's own page says it plainly: this is "what the market is priced for versus what companies actually earn" — three lights, five charts, and the fear gauge, built for a daily check. That framing is the whole philosophy. Stock prices are bets on the future; earnings are the reality those bets get measured against. When the two drift apart — when expectations run far ahead of reality — that is exactly what this dashboard is built to show.
Luke's rule for the indicator is simple, and he has said it on camera: when expected earnings growth keeps expanding, the climate is warming; when it starts shrinking — even while it is still positive — the climate is cooling. Warming is not a buy signal and cooling is not a sell signal. They are weather. You dress for the weather; you do not argue with it.
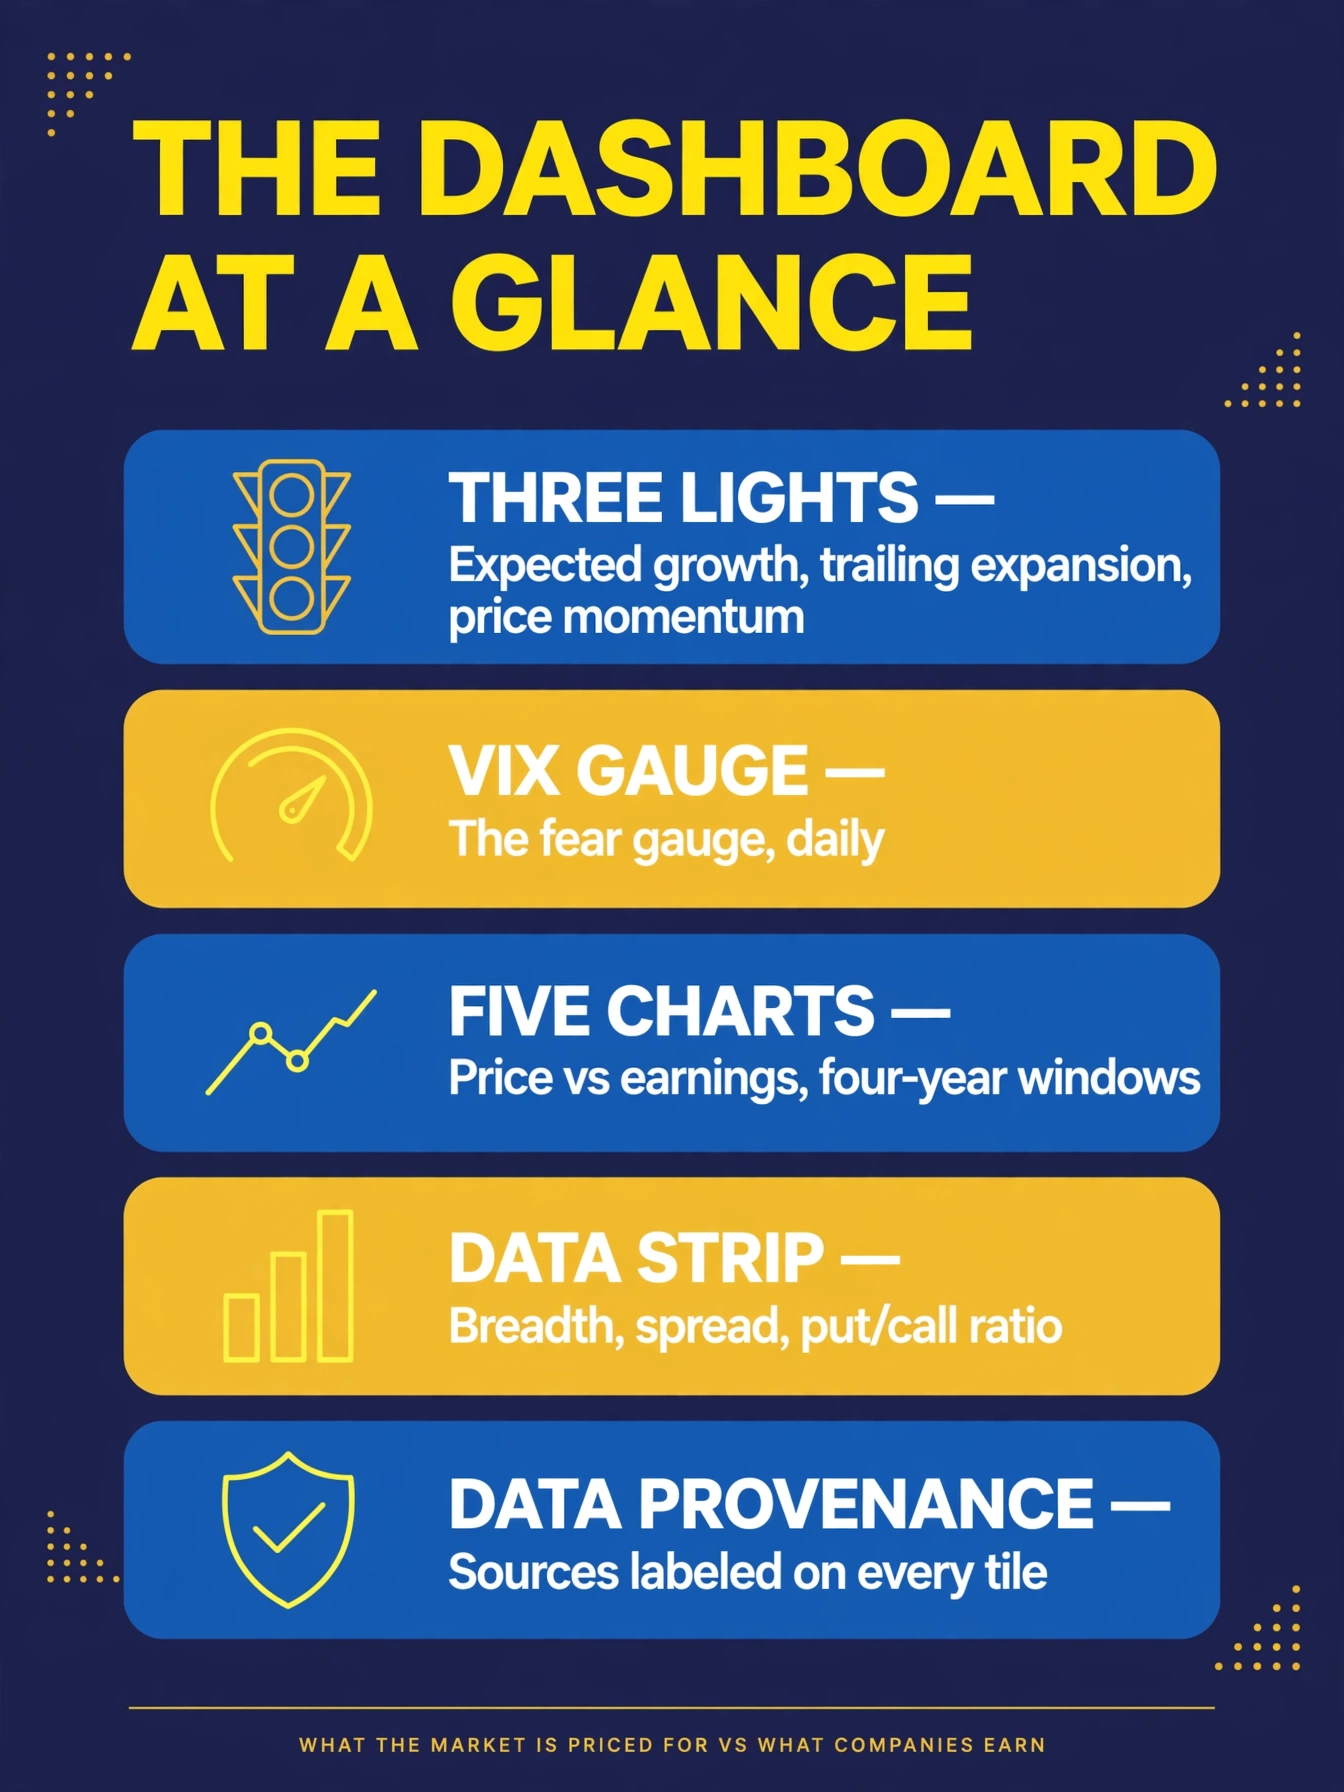
The dashboard has five parts, top to bottom. First, the three indicator lights — the headline read. Second, the VIX gauge, the market's fear meter. Third, five charts that plot price against earnings over multi-year windows. Fourth, a supporting data strip with market breadth, the yield-curve spread, and the put/call ratio. Fifth, a data-provenance section that tells you exactly where every number comes from. Nothing on the dashboard is a black box; every tile labels its source.
The Three Lights
The lights are the first thing you read, and each one asks a single question.
Light 1 — Expected EPS Growth. Are analysts' expectations for the next twelve months of S&P 500 earnings higher or lower than they were 52 weeks ago? The dashboard compares this week's forward 12-month EPS estimate against the same estimate a year earlier. Green means expectations are expanding; yellow means expectations are being cut.
Light 2 — Trailing EPS Expansion. Are the earnings companies actually reported over the last twelve months growing or shrinking versus last quarter? This is the reality check. Green means actual earnings are accelerating; yellow means they are decelerating.
Light 3 — Weekly Price Momentum. Is the S&P 500 up or down versus five trading sessions ago? Green means up on the week; yellow means down on the week. This is the fastest-moving of the three — it is the only light that reads price instead of earnings.
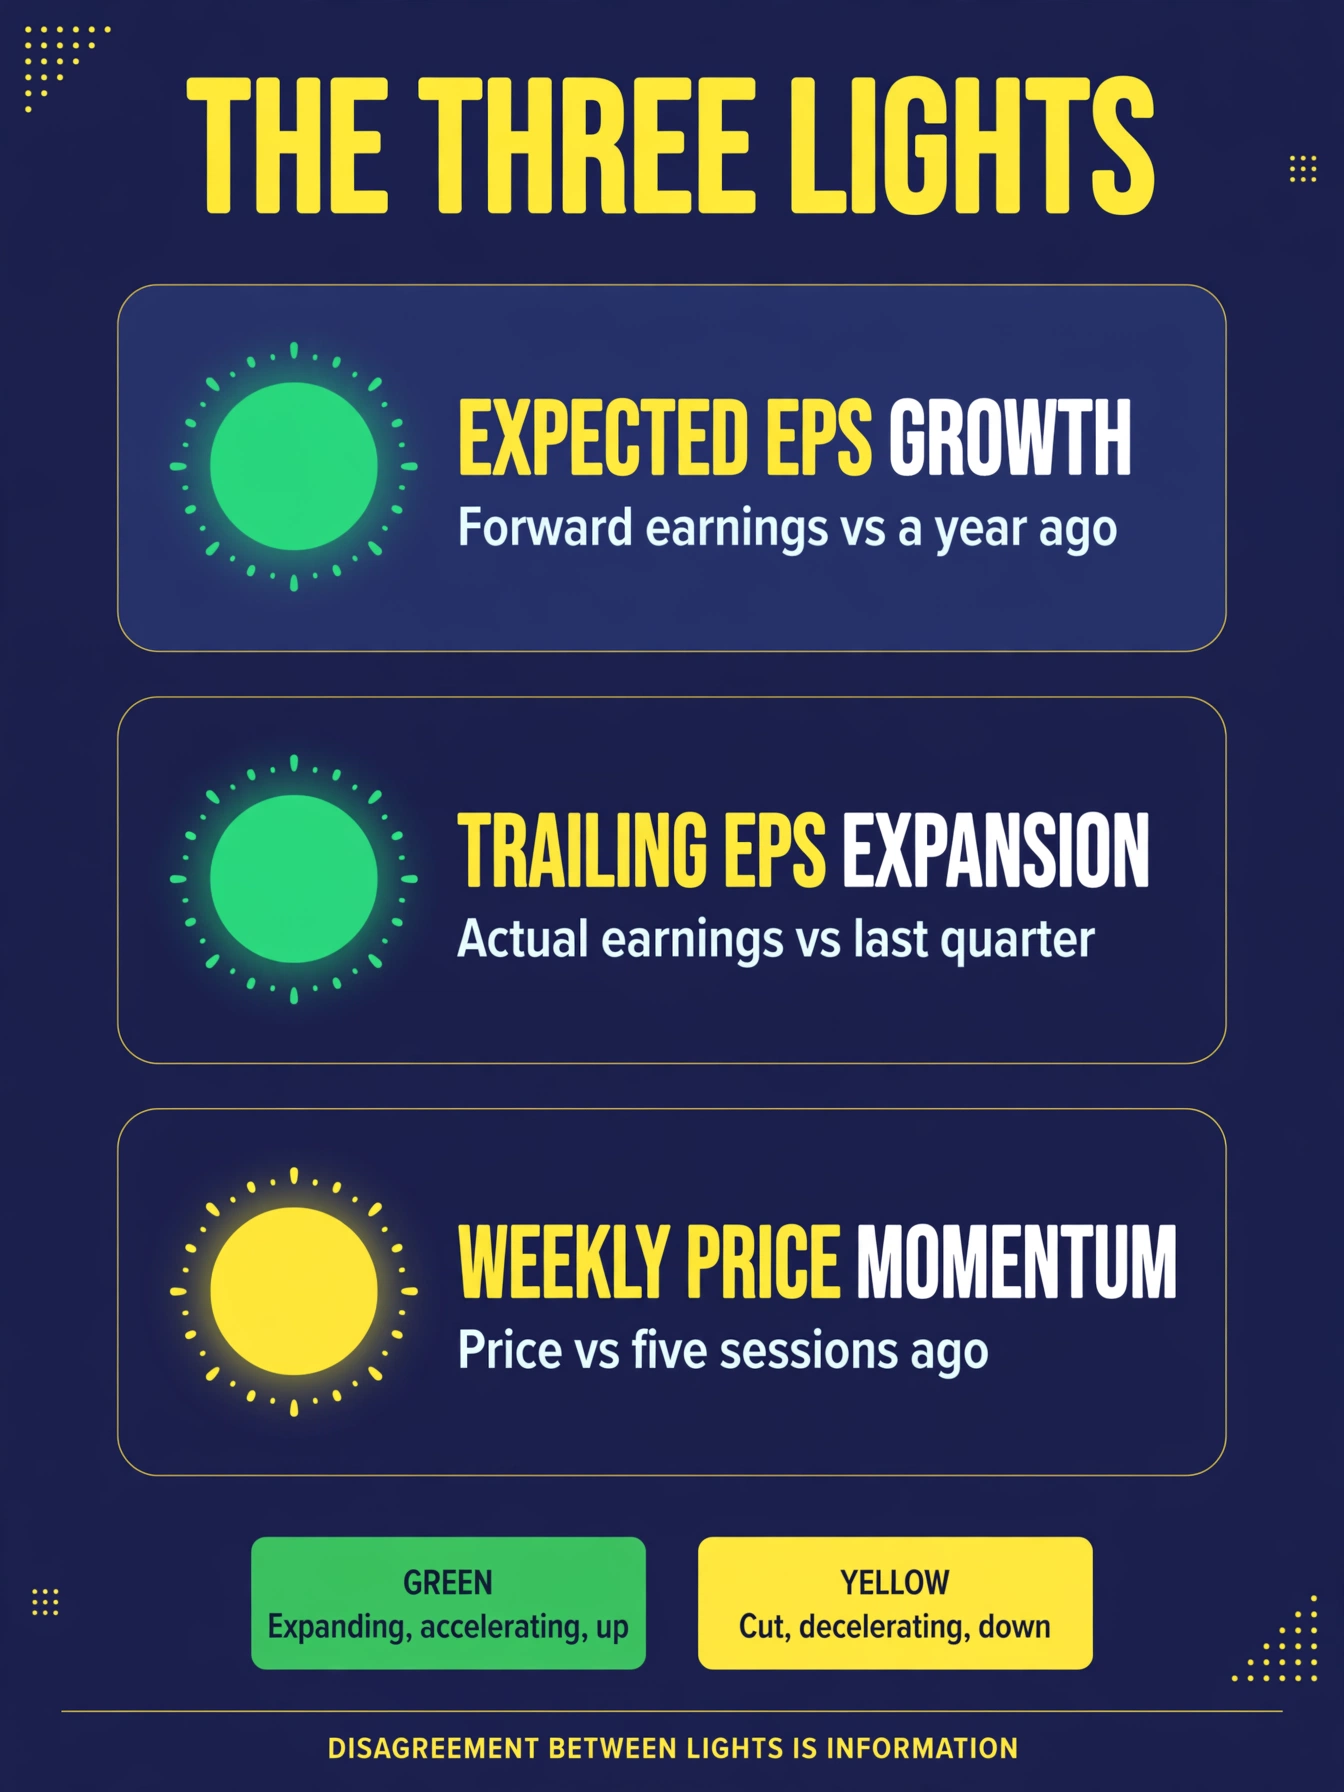
The dashboard's own guide to the colors: green across the board means expectations expanding, actual earnings accelerating, price up on the week — "the climate favors putting money to work." Yellow means the line turned down — expectations being cut, earnings decelerating, or price down on the week — "the climate favors caution, smaller size, and protection."
Here is the part most people miss: the three lights do not always agree, and that disagreement is information. Expectations can be green while reality is yellow — the market priced for growth that never arrived. That gap is the whole point of the instrument. Read each light on its own before you blend them into a judgment.
The Five Charts
Below the lights sit five charts, and they all do one job: they put price and earnings on the same page so you can see the gap with your own eyes.
- Price vs Expected Earnings Growth — the S&P 500 weekly close with the year-over-year expected EPS growth rate, over a four-year window.
- Price vs Trailing EPS — the S&P 500 weekly close with trailing twelve-month operating EPS, four years.
- Fused composite — all three together: weekly candlesticks over the quarterly background, three years, with a strip along the bottom showing the expected-growth direction week by week (green when the week's growth rose, red when it fell).
- Expected EPS Growth Rate — the raw expected-growth indicator by itself, one year, wiggling around a dashed zero line.
- Trailing EPS Rate of Change — the quarterly rate of change in trailing twelve-month EPS, four years, green above zero and red below.
Every dated chart tile follows Luke's background-color rule: each quarter of background is shaded by trailing-EPS momentum — green when the quarter-over-quarter growth rate accelerated versus the prior quarter, red when it decelerated. The color is not decoration; it is the climate history written into the chart. Learn to read the background before you read the lines.
The Fear Gauge and the Data Strip
The VIX gauge measures expected volatility — the market's fear level — and it refreshes daily. The dashboard's zones: below 12 is extreme greed (complacent), 12–16 is greed, 16–20 is neutral, 20–30 is fear, and above 30 is extreme fear. Fear is not automatically bad and greed is not automatically good; they are context. Extreme complacency near market tops and panic near bottoms are the patterns to notice.
The data strip carries supporting evidence: market breadth (the percentage of S&P 500 stocks above their 50-day moving average, computed daily), the 10-year minus 2-year Treasury spread from FRED, and the total put/call ratio from CBOE. These are the dashboard's supporting cast — they confirm or question what the lights and charts say.
How Often It Updates
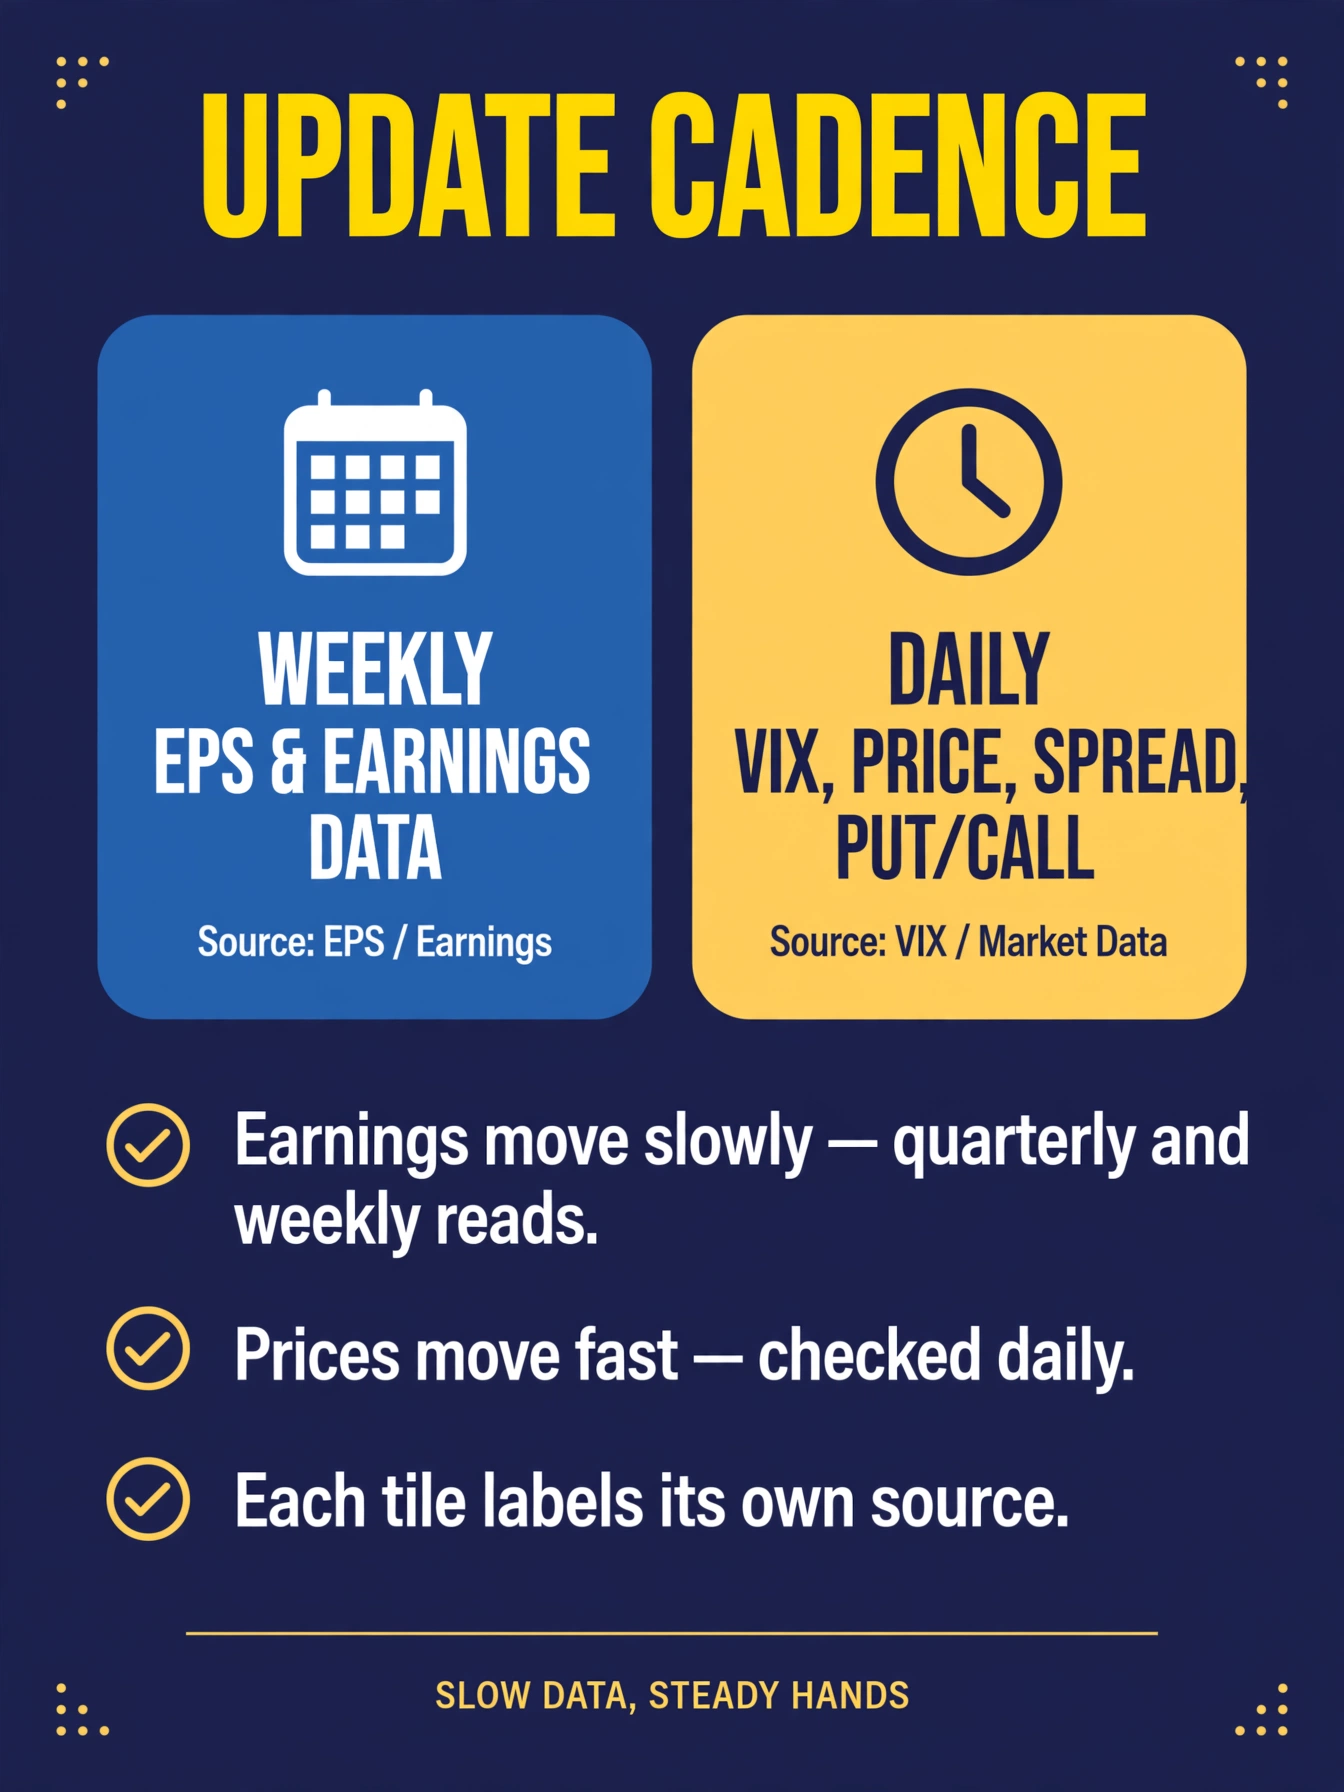
Not everything on the dashboard moves at the same speed, and knowing the cadence keeps you from overreacting. The two earnings lights refresh with the weekly and quarterly EPS data — earnings move slowly, so the climate read moves slowly. The VIX, the S&P 500, the spread, and the put/call ratio refresh daily. The page itself re-checks its data hourly. Check the lights weekly; glance at the fear gauge daily. The climate is a slow instrument — that is a feature, not a flaw.
What It Cannot Do
Honest limits, up front. The dashboard is a money-management framework, not a trade signal — it tells you about the weather, not which boat to buy or when to set sail. It will never tell you the exact day to enter a trade; Luke deliberately does not use it for trade entries at all. Earnings data arrives quarterly and updates weekly, so the climate can be slow to turn — it will not catch a one-day panic, and it is not trying to. And it is not financial advice: the dashboard says so itself, and so does this Academy. Before making any money moves, talk to a qualified financial adviser who knows your situation.
Key terms
- Market climate
- Luke's weather-style read of the market: what the market is priced for versus what companies actually earn.
- Expected EPS Growth (Light 1)
- whether the forward 12-month S&P 500 EPS estimate is higher or lower than 52 weeks ago; green when expanding, yellow when being cut.
- Trailing EPS Expansion (Light 2)
- whether trailing twelve-month S&P 500 EPS is growing or shrinking versus last quarter; green when accelerating, yellow when decelerating.
- Weekly Price Momentum (Light 3)
- whether the S&P 500 is up or down versus five trading sessions ago; green when up, yellow when down.
- Trailing-EPS momentum shading
- Luke's background-color rule: every dated chart tile shades each quarter green when quarter-over-quarter growth accelerated vs the prior quarter, red when it decelerated.
- VIX
- the market's fear gauge; below 12 extreme greed, 12–16 greed, 16–20 neutral, 20–30 fear, above 30 extreme fear.
- Market breadth
- the percentage of S&P 500 stocks above their 50-day moving average; a measure of how wide a rally or selloff runs.
- Put/call ratio
- total put volume divided by call volume from CBOE; a sentiment read on how much protection traders are buying.
- 10Y–2Y spread
- the 10-year Treasury yield minus the 2-year yield, from FRED; a classic recession-warning gauge.
- Data provenance
- the documented source of every number on the dashboard; forward EPS from a Yardeni Research chart of LSEG I/B/E/S data, trailing EPS from LSEG I/B/E/S *This Week in Earnings*, prices from S&P 500 weekly closes.
What's next
You can read the instrument; now learn its most important input. MC-202 "Expected Earnings Growth" takes apart the year-over-year forward EPS growth rate — what it measures, how to read its direction and acceleration, and why the climate warms when it expands and cools when it shrinks.
The quiz
Market Climate Indicator — Quiz
3 questions · pass with 3 correct
1.What is the Market Climate Indicator for?
2.What does a green Light 1 (Expected EPS Growth) mean?
3.How does each quarter of a chart's background get its color?