
Expected Earnings Growth
School 06 — Market Climate Lab
School 6 · Market Climate Lab · About 15 minutes
Of Luke's three self-researched metrics, expected earnings growth is the one he watches most closely — "the number we track every week." It is also the trickiest for beginners, because it asks you to think one level removed from the news: not what companies earned, but what the market currently expects them to earn, and whether that expectation is growing or shrinking. This class makes that idea concrete: what forward EPS is, why we compare it year over year, and the difference between a growth rate's direction and its acceleration — the difference the whole dashboard is built to catch.
What the Market Is Priced For
Stock prices are bets on the future. When you see the S&P 500 at some level, you are seeing what millions of investors collectively expect companies to earn going forward — not what they earned last year. Forward EPS is the estimate of what the market's companies will earn over the next twelve months, added up across the index. It is not a fact; it is a forecast, built from analysts' estimates. And because prices move on forecasts, the forecast is what you have to watch.
Luke's first metric — expected earnings growth — is simply the year-over-year change in that forecast. Take this week's forward EPS estimate, compare it to the forward EPS estimate from 52 weeks ago, and the difference is the growth rate of expectations. If the number is higher than it was a year ago, expectations are expanding. If it is lower, expectations are being cut. That is Light 1 on the dashboard, and it is the single most-watched input in the climate framework.
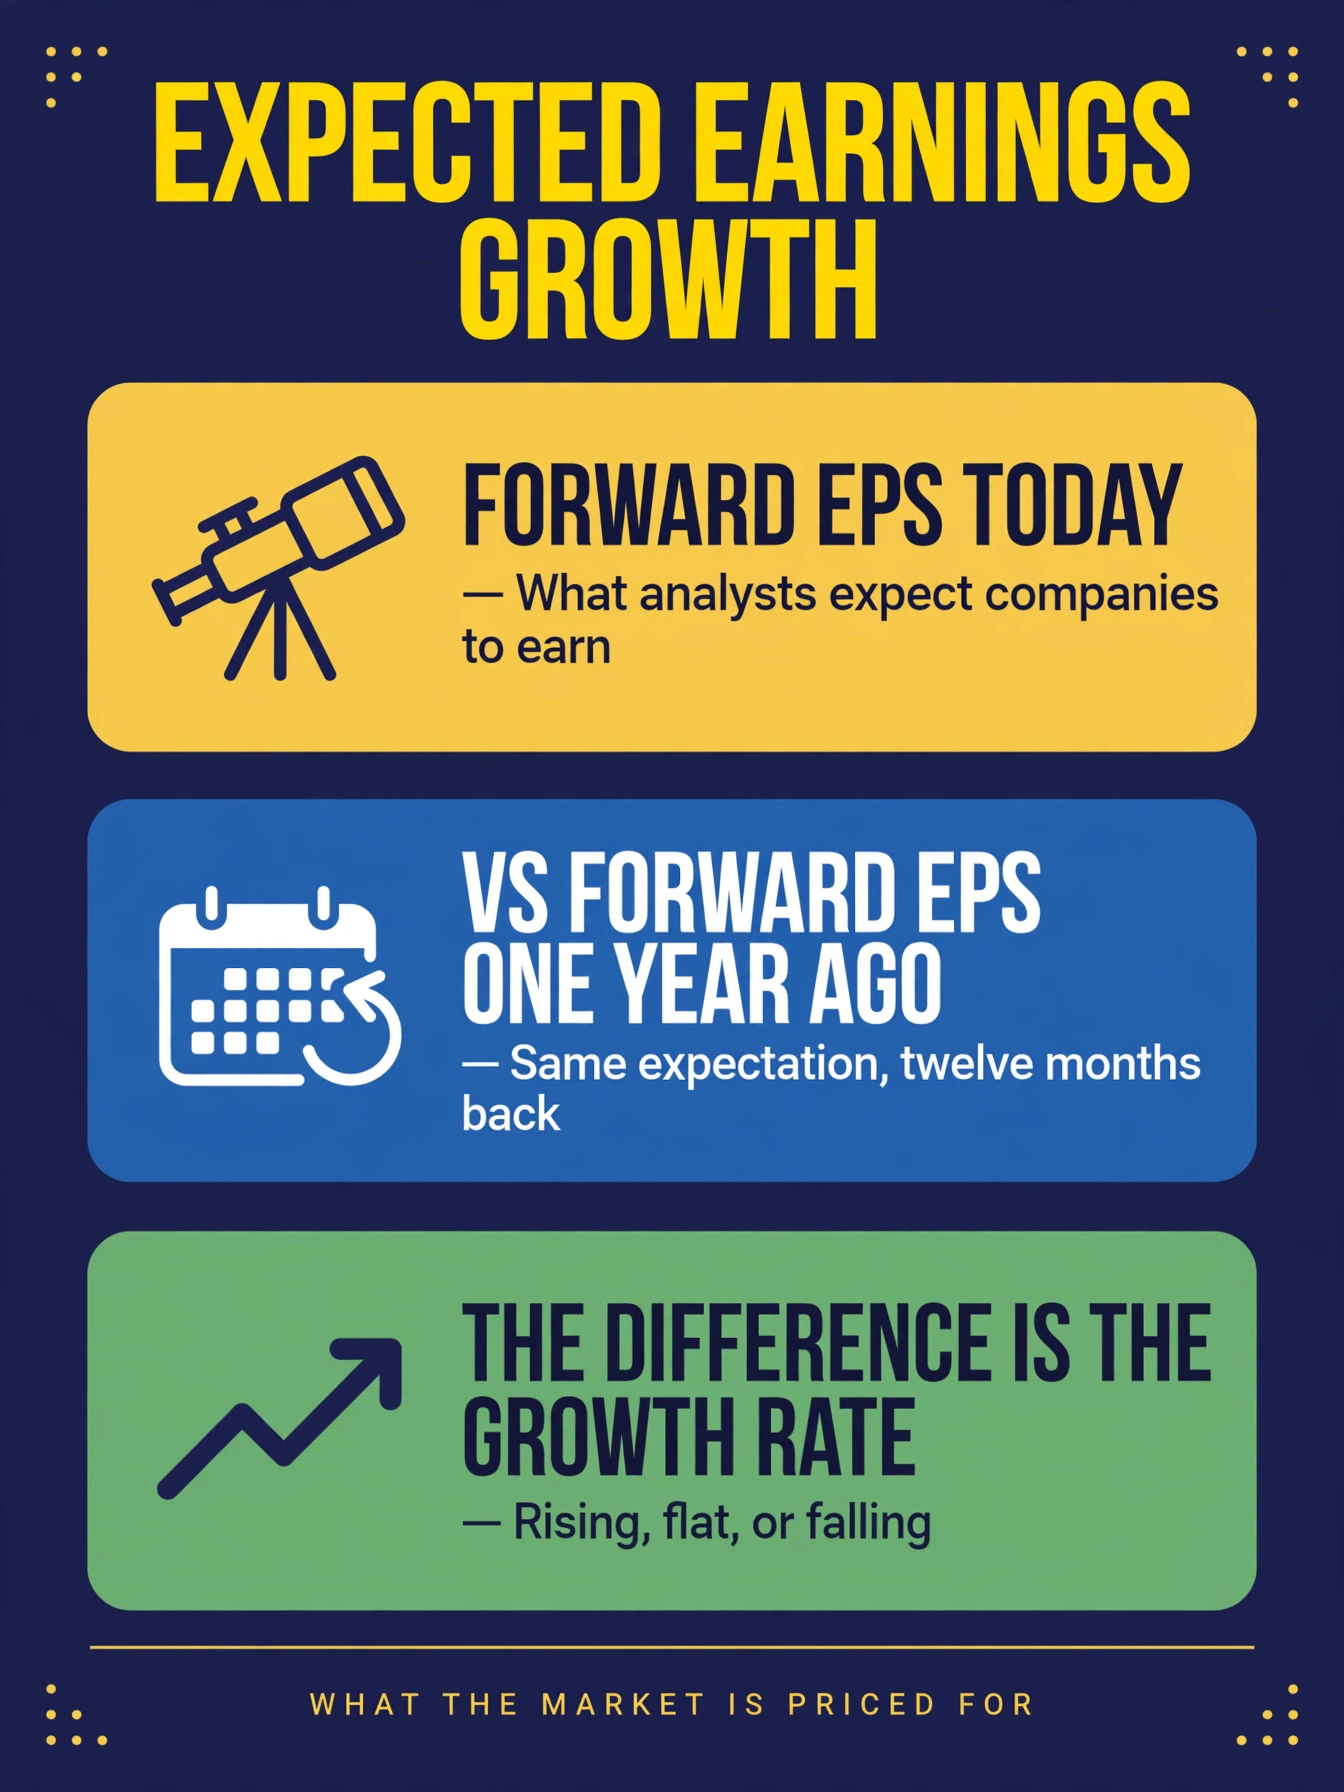
Why compare against a year ago instead of last week or last month? Because a year-over-year comparison washes out the short-term noise. Analysts nudge their estimates constantly — a single week's revision means little. But the same expectation measured twelve months apart shows you the real trend: are the market's hopes for the future genuinely rising, or quietly eroding? The dashboard's formula does exactly this: this week's forward EPS divided by the forward EPS from 52 weeks earlier, minus one. The result is a growth rate, plain and simple.
Direction Is Not Acceleration
Here is where most beginners stop one level too early — and where the climate indicator earns its keep. A growth rate has two properties, not one: its direction (is it rising or falling?) and its acceleration (is the rise speeding up or slowing down?).
Imagine a car. Direction tells you whether it is moving forward or backward. Acceleration tells you whether the driver is pressing the gas or lifting off. A car can be moving forward while slowing down — and a slowing car is about to behave very differently from an accelerating one, even though both are "going forward."
Expected earnings growth works the same way. Growth can be positive but decelerating — still above zero, but rising more slowly than before. Luke's on-camera rule captures this exactly: "when expected earnings growth keeps expanding, the climate is warming; when it starts shrinking — even while it's still positive — the climate is cooling." The cooling starts before growth turns negative. The dashboard is designed to catch the lift-off-the-gas moment, not just the moment the car stops.
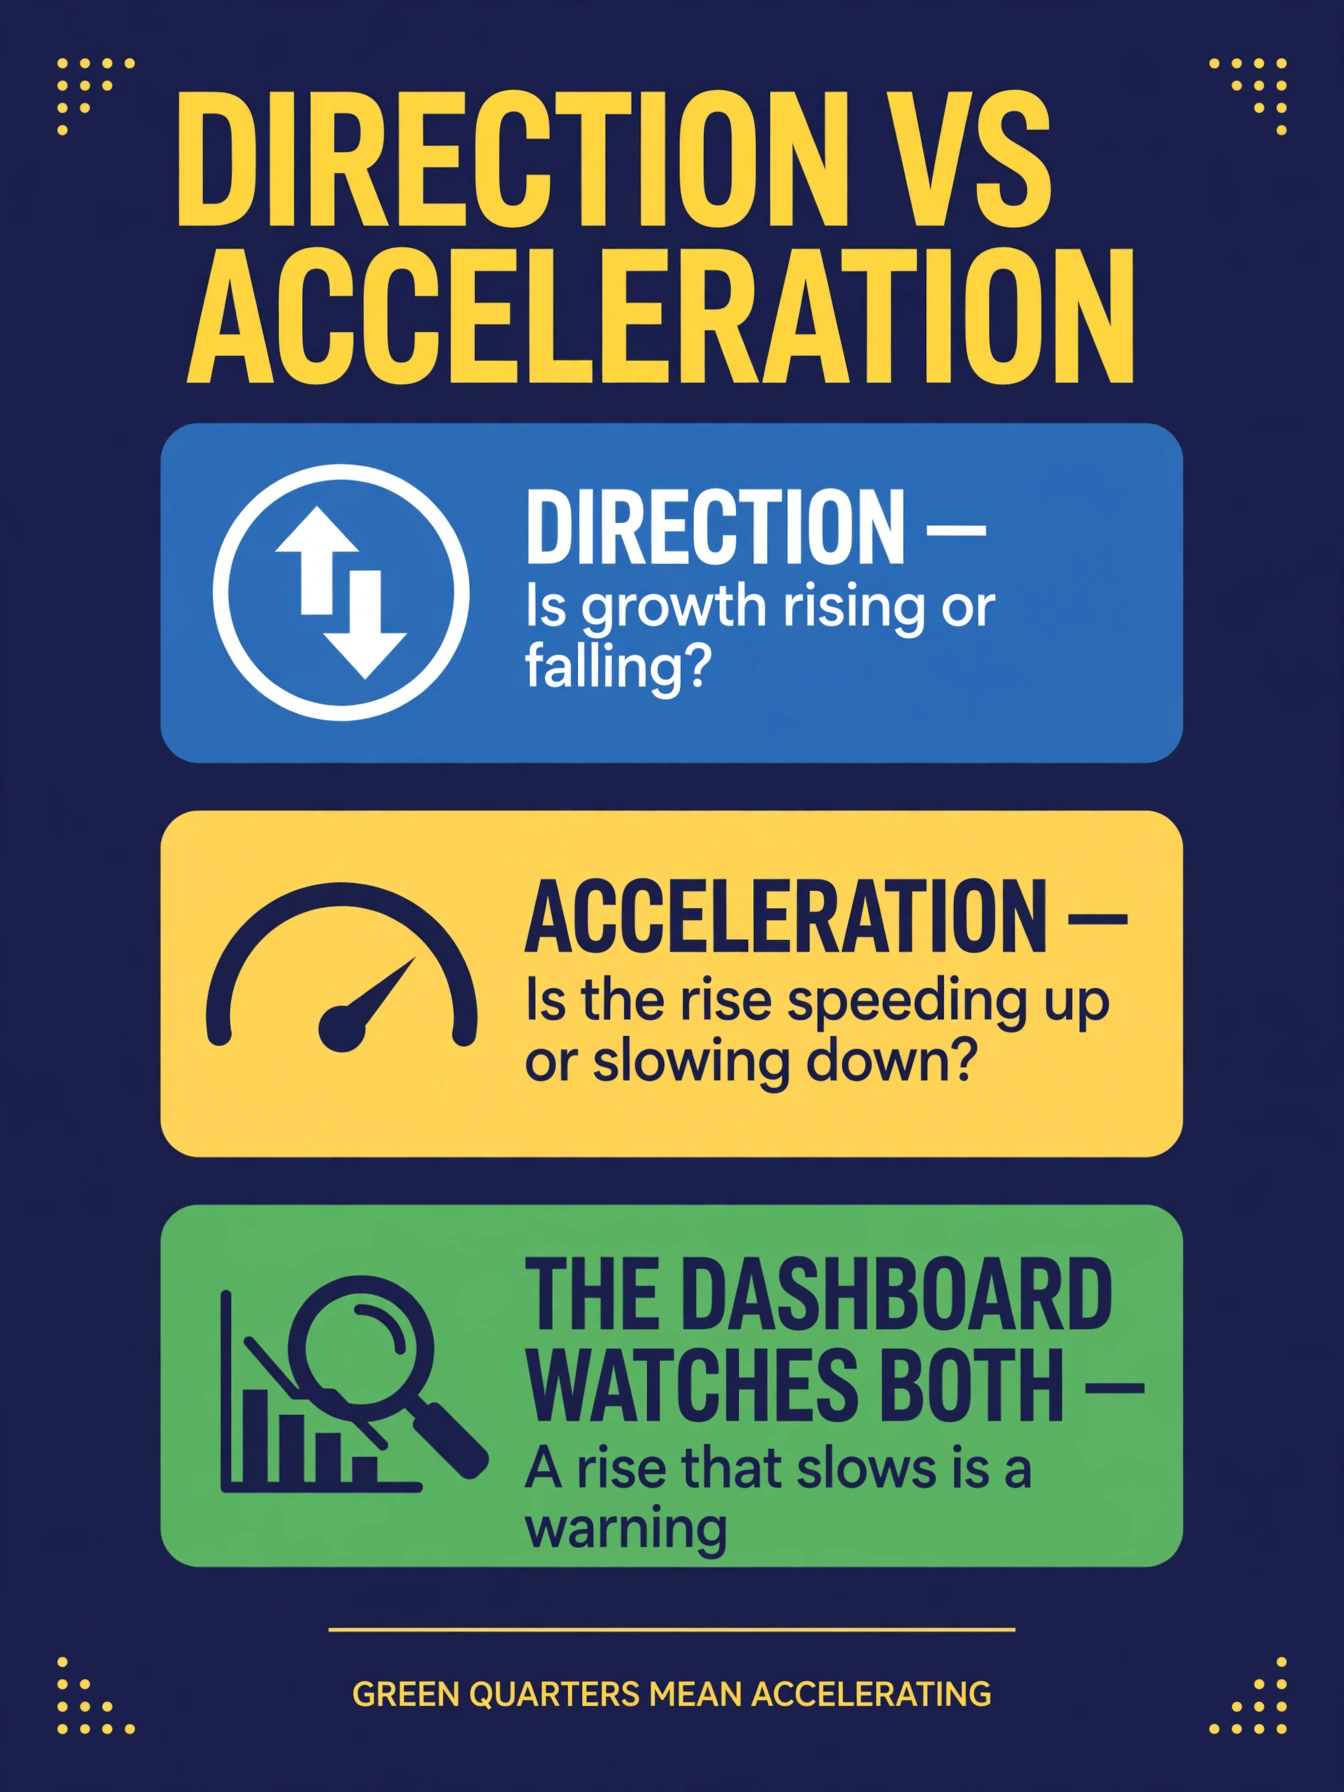
This is why the chart backgrounds matter. Remember Luke's rule from MC-201: each quarter is shaded by trailing-EPS momentum — green when quarter-over-quarter growth accelerated versus the prior quarter, red when it decelerated. A red quarter does not mean earnings fell. It means the growth slowed. Learning to see deceleration inside positive growth is the single most valuable reading skill in this school.
Reading the Line Around Zero
The dashboard's "Expected EPS Growth Rate" tile plots the raw growth rate wiggling around a dashed zero line, and the zero line is your anchor. Above zero means expectations are growing versus a year ago — the market is pricing in a richer future. On zero means no growth is expected — expectations are flat. Below zero means expectations are shrinking — analysts collectively expect less than they did a year ago.
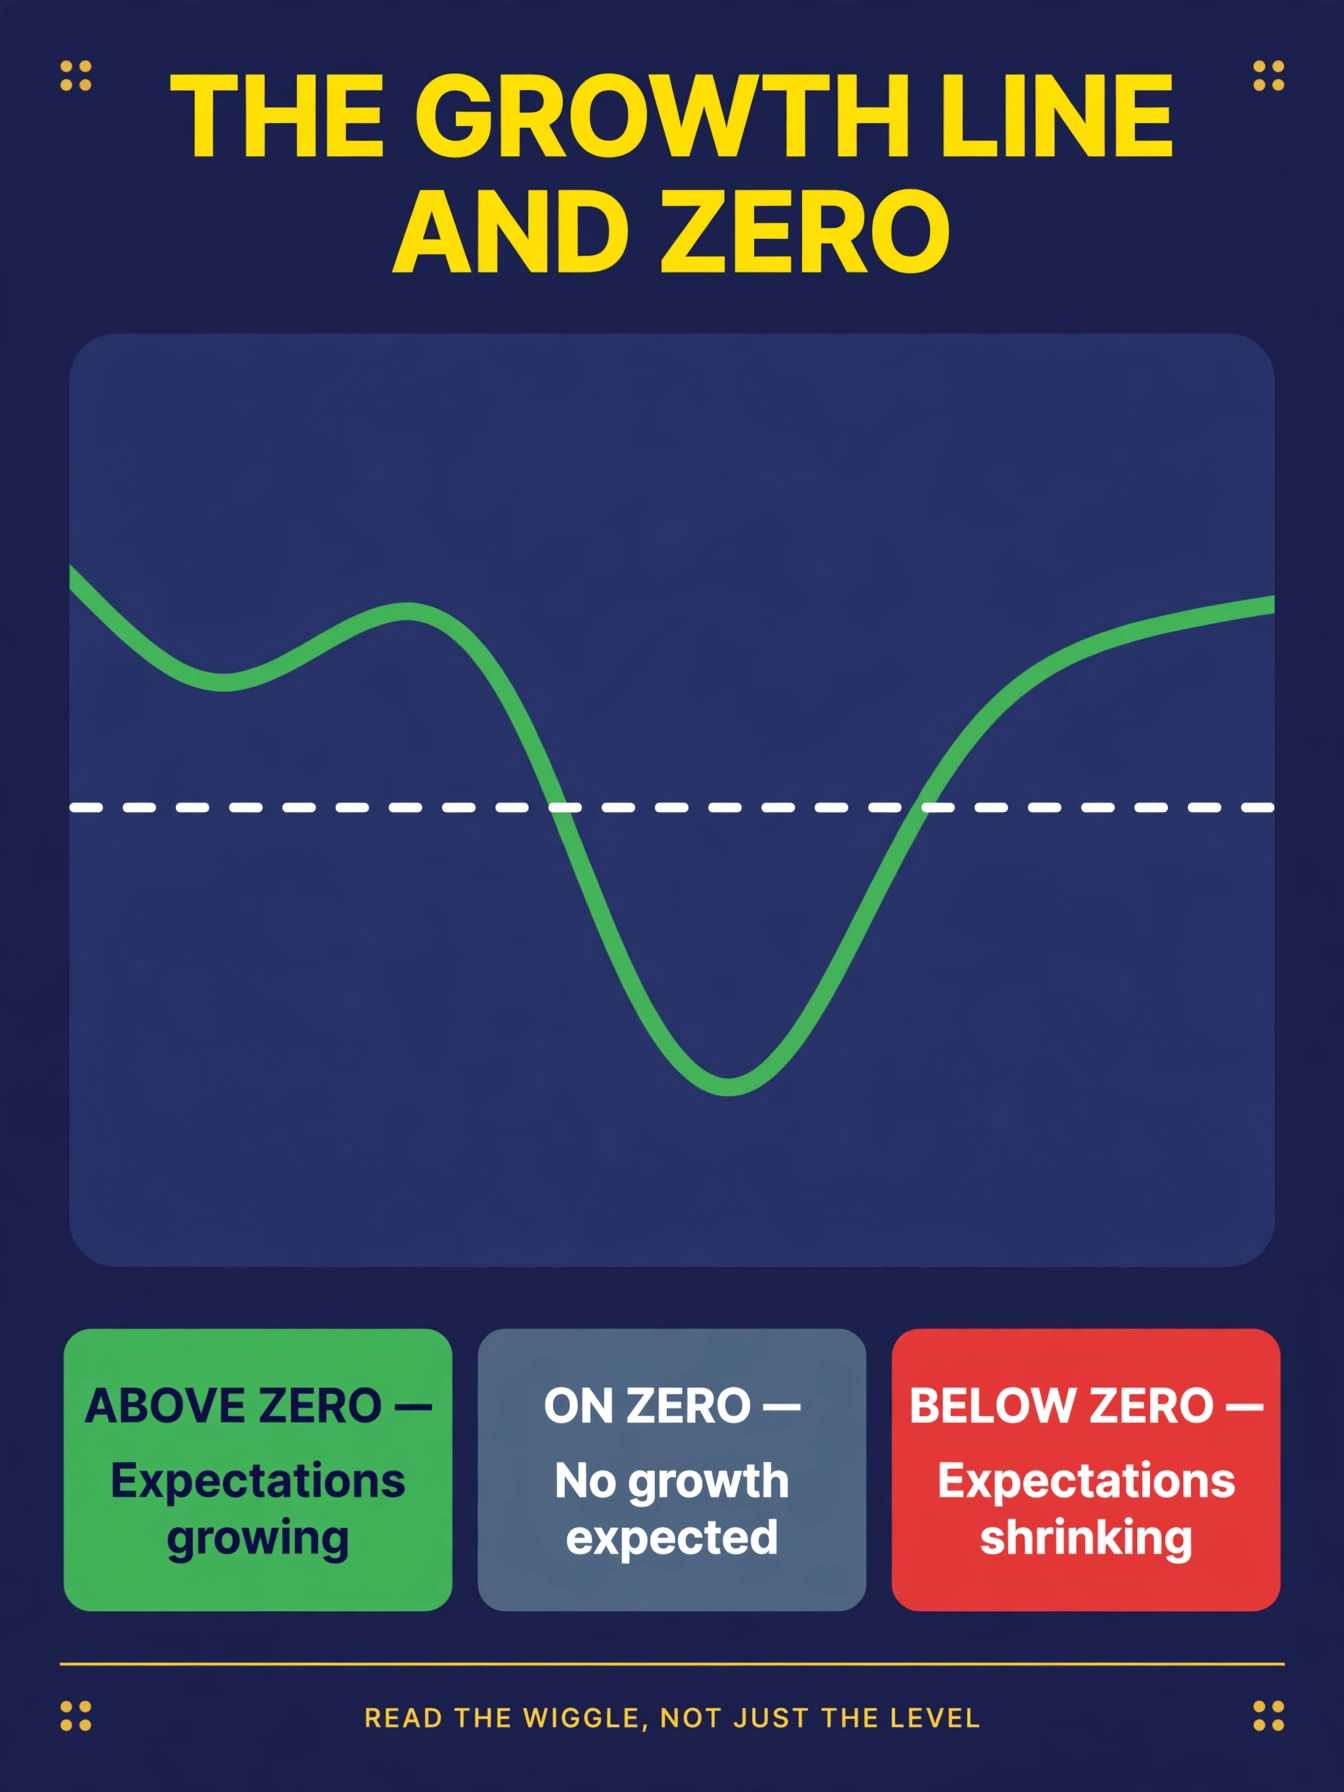
But do not just read the level — read the wiggle. A line climbing away from zero is expansion gaining steam. A line flattening near the top is growth running out of breath. A line crossing below zero is the climate turning cold. And the steepest, most informative moves are the turns: the moment a long decline bottoms and hooks upward is often the earliest hint that the climate is warming again. The line is a story; zero is just one chapter marker in it.
Where the Numbers Come From
A metric is only as good as its data, so here is the provenance, straight from the dashboard. The forward EPS series is digitized from a published Yardeni Research chart built on LSEG I/B/E/S data, with estimated accuracy of about one percent. It updates weekly, alongside the other EPS inputs. Because the series is transcribed and digitized rather than pulled from a live feed, the dashboard team annotates anomalies — like the one-time items that distorted the second quarter of 2026 — instead of smoothing them away. When something unusual hits the numbers, you will see a note explaining it, not a quietly doctored chart. That honesty is part of the instrument.
Key terms
- Forward EPS
- the estimated earnings of the market's companies over the next twelve months; a forecast, not a fact.
- Expected earnings growth
- the year-over-year change in forward EPS: this week's estimate versus the estimate 52 weeks ago.
- Direction
- whether a growth rate is rising or falling.
- Acceleration
- whether a growth rate's rise is speeding up or slowing down; deceleration inside positive growth is an early cooling signal.
- Warming / cooling climate
- Luke's plain-English read: expanding expected earnings growth means warming; shrinking growth — even while still positive — means cooling.
- Zero axis
- the line on the growth-rate chart separating positive expected growth (above) from shrinking expectations (below).
- Data provenance
- forward EPS is digitized from a Yardeni Research chart of LSEG I/B/E/S data (±1% accuracy), updated weekly; anomalies are annotated, not smoothed.
What's next
Expected growth tells you what the market hopes for. MC-203 "Trailing and Forward EPS" adds the reality check — what companies actually earned, how the trailing light reads quarter-over-quarter momentum, and what happens when expectations and reality disagree.
The quiz
Expected Earnings Growth — Quiz
4 questions · pass with 3 correct
1.What is expected earnings growth?
2.Expected earnings growth is still positive, but it is decelerating. What does that mean?
3.What does it mean when the expected-growth line falls below the zero axis?
4.Where does the dashboard's forward EPS data come from?