
Trailing and Forward EPS
School 06 — Market Climate Lab
School 6 · Market Climate Lab · About 15 minutes
Expectations are only half the climate. The other half is reality: what companies actually earned. Luke's second and third self-researched metrics — trailing EPS and forward EPS — are the two sides of that comparison. Trailing EPS is the rearview mirror: the earnings already in the books. Forward EPS is the windshield: what analysts expect next. The climate indicator holds them up against each other, because the gap between what the market is priced for and what companies actually earn is where the most important information lives.
The Rearview Mirror and the Windshield
Trailing EPS is the earnings per share the market's companies actually reported over the last twelve months — real money, already earned, already announced. The dashboard uses trailing twelve-month operating EPS for the S&P 500, transcribed from LSEG I/B/E/S This Week in Earnings. It cannot be revised by hope; it can only be revised by restatements and one-time items, which the dashboard annotates openly.
Forward EPS is the forecast: what analysts collectively expect those companies to earn over the next twelve months. It moves every week as analysts update their models — on earnings reports, on economic data, on anything that changes the outlook.
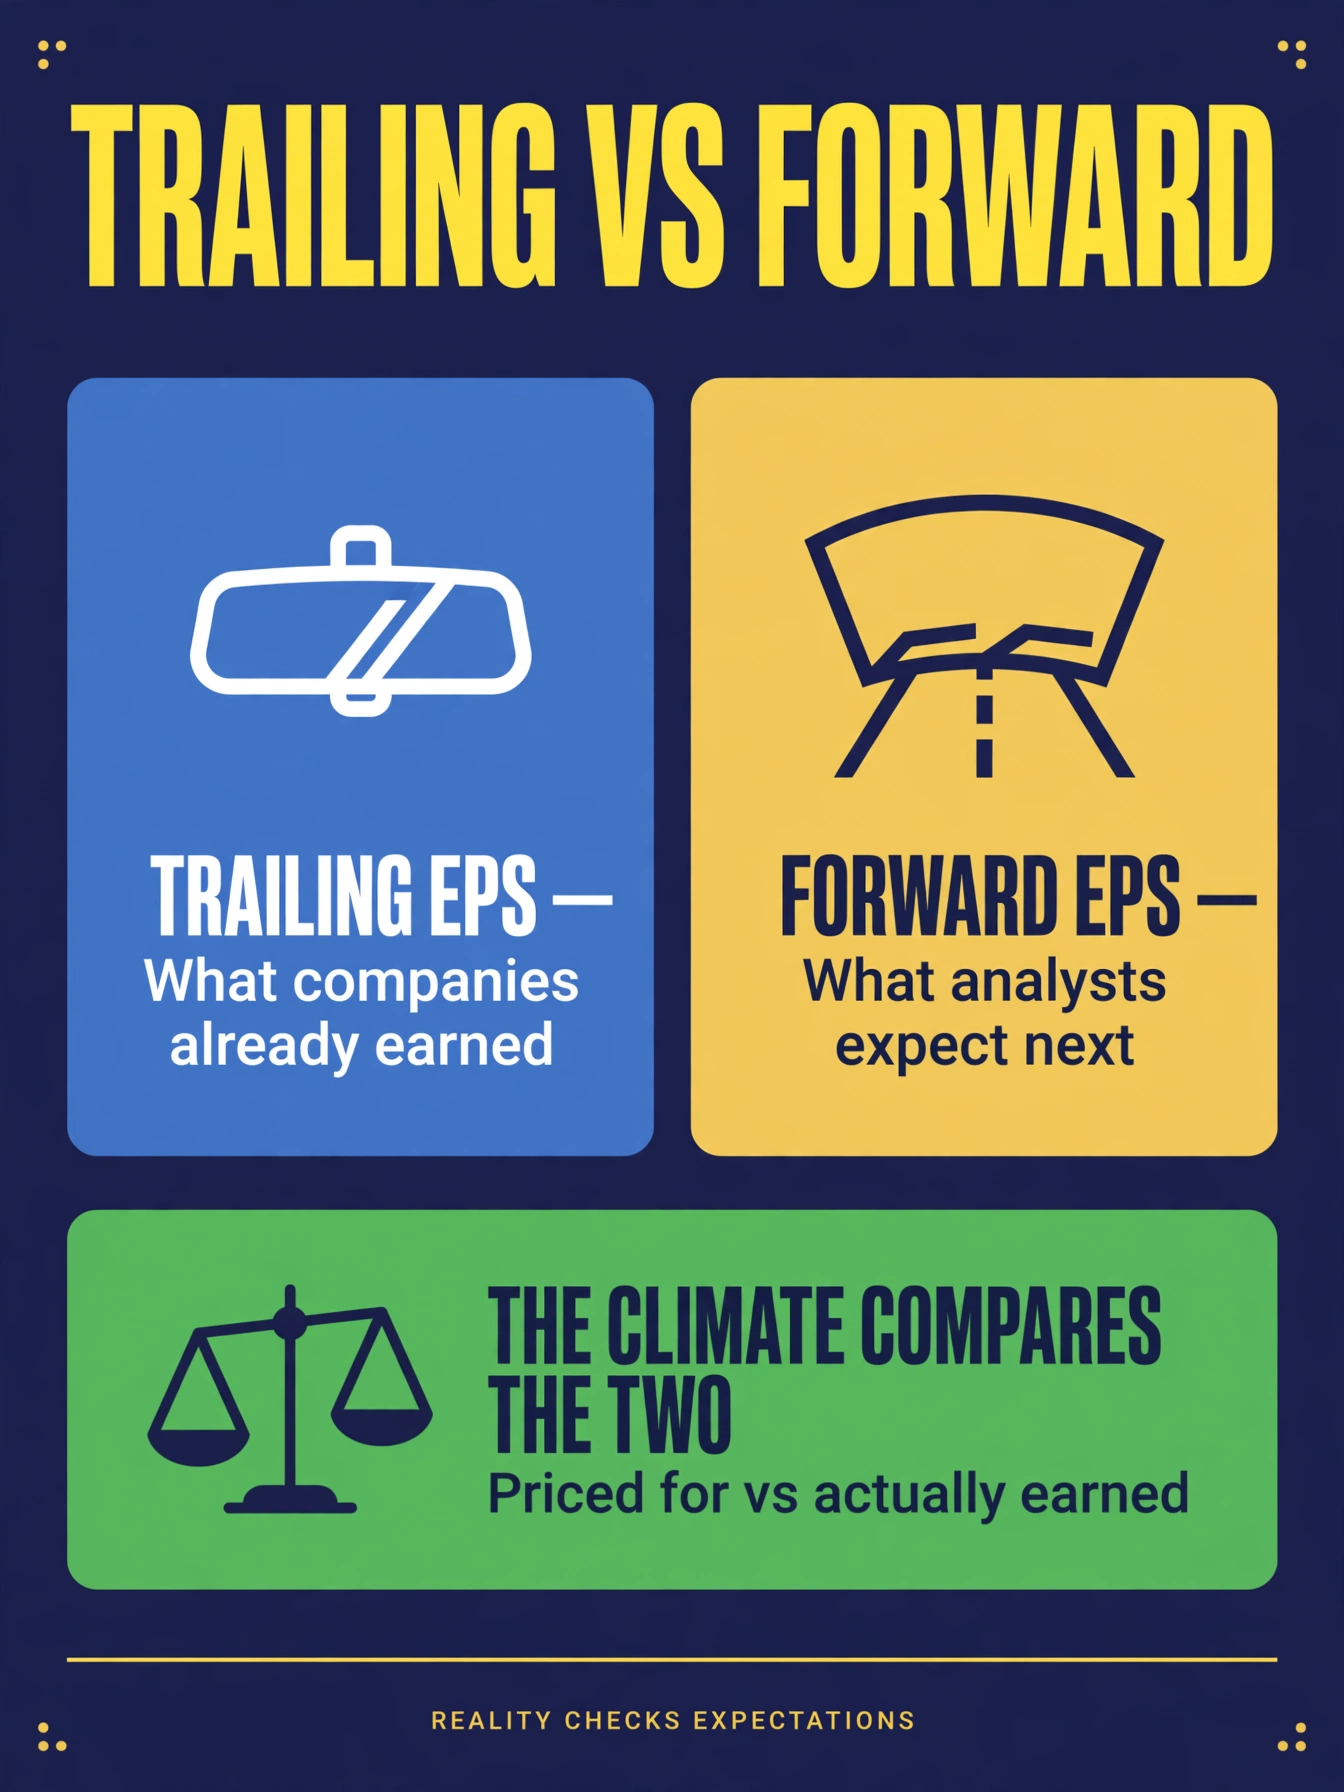
Neither number means much alone. Trailing EPS without forward EPS is driving by rearview mirror — you know exactly where you have been and nothing about the curve ahead. Forward EPS without trailing EPS is a forecast with no anchor — hopes untested against results. The climate read needs both, because its central question is always the same: does reality support what the price assumes?
The Trailing Light's Quarterly Question
Light 2 on the dashboard — Trailing EPS Expansion — asks one question each week: is trailing twelve-month EPS higher or lower than it was last quarter? The dashboard divides this quarter's trailing EPS by last quarter's and subtracts one. Green means actual earnings are still expanding; yellow means the expansion is faltering — earnings decelerating.
Notice the different rhythm from Light 1. Expected growth compares against a year ago, because expectations wiggle weekly and need a long baseline. Trailing EPS compares quarter to quarter, because real earnings arrive in quarterly reports — the number only genuinely changes four times a year, and the dashboard is honest about that slower heartbeat. A yellow trailing light does not mean companies lost money. It means the rate at which real earnings are growing has turned down. That is the deceleration concept from MC-202, applied to reality instead of hopes.
The Background Color of Every Chart
Here is Luke's cross-tile rule, the one he insisted be clearly visible: every dated chart tile on the dashboard colors its background quarterly by trailing-EPS momentum — green when the quarter-over-quarter growth rate accelerated versus the prior quarter, red when it decelerated.
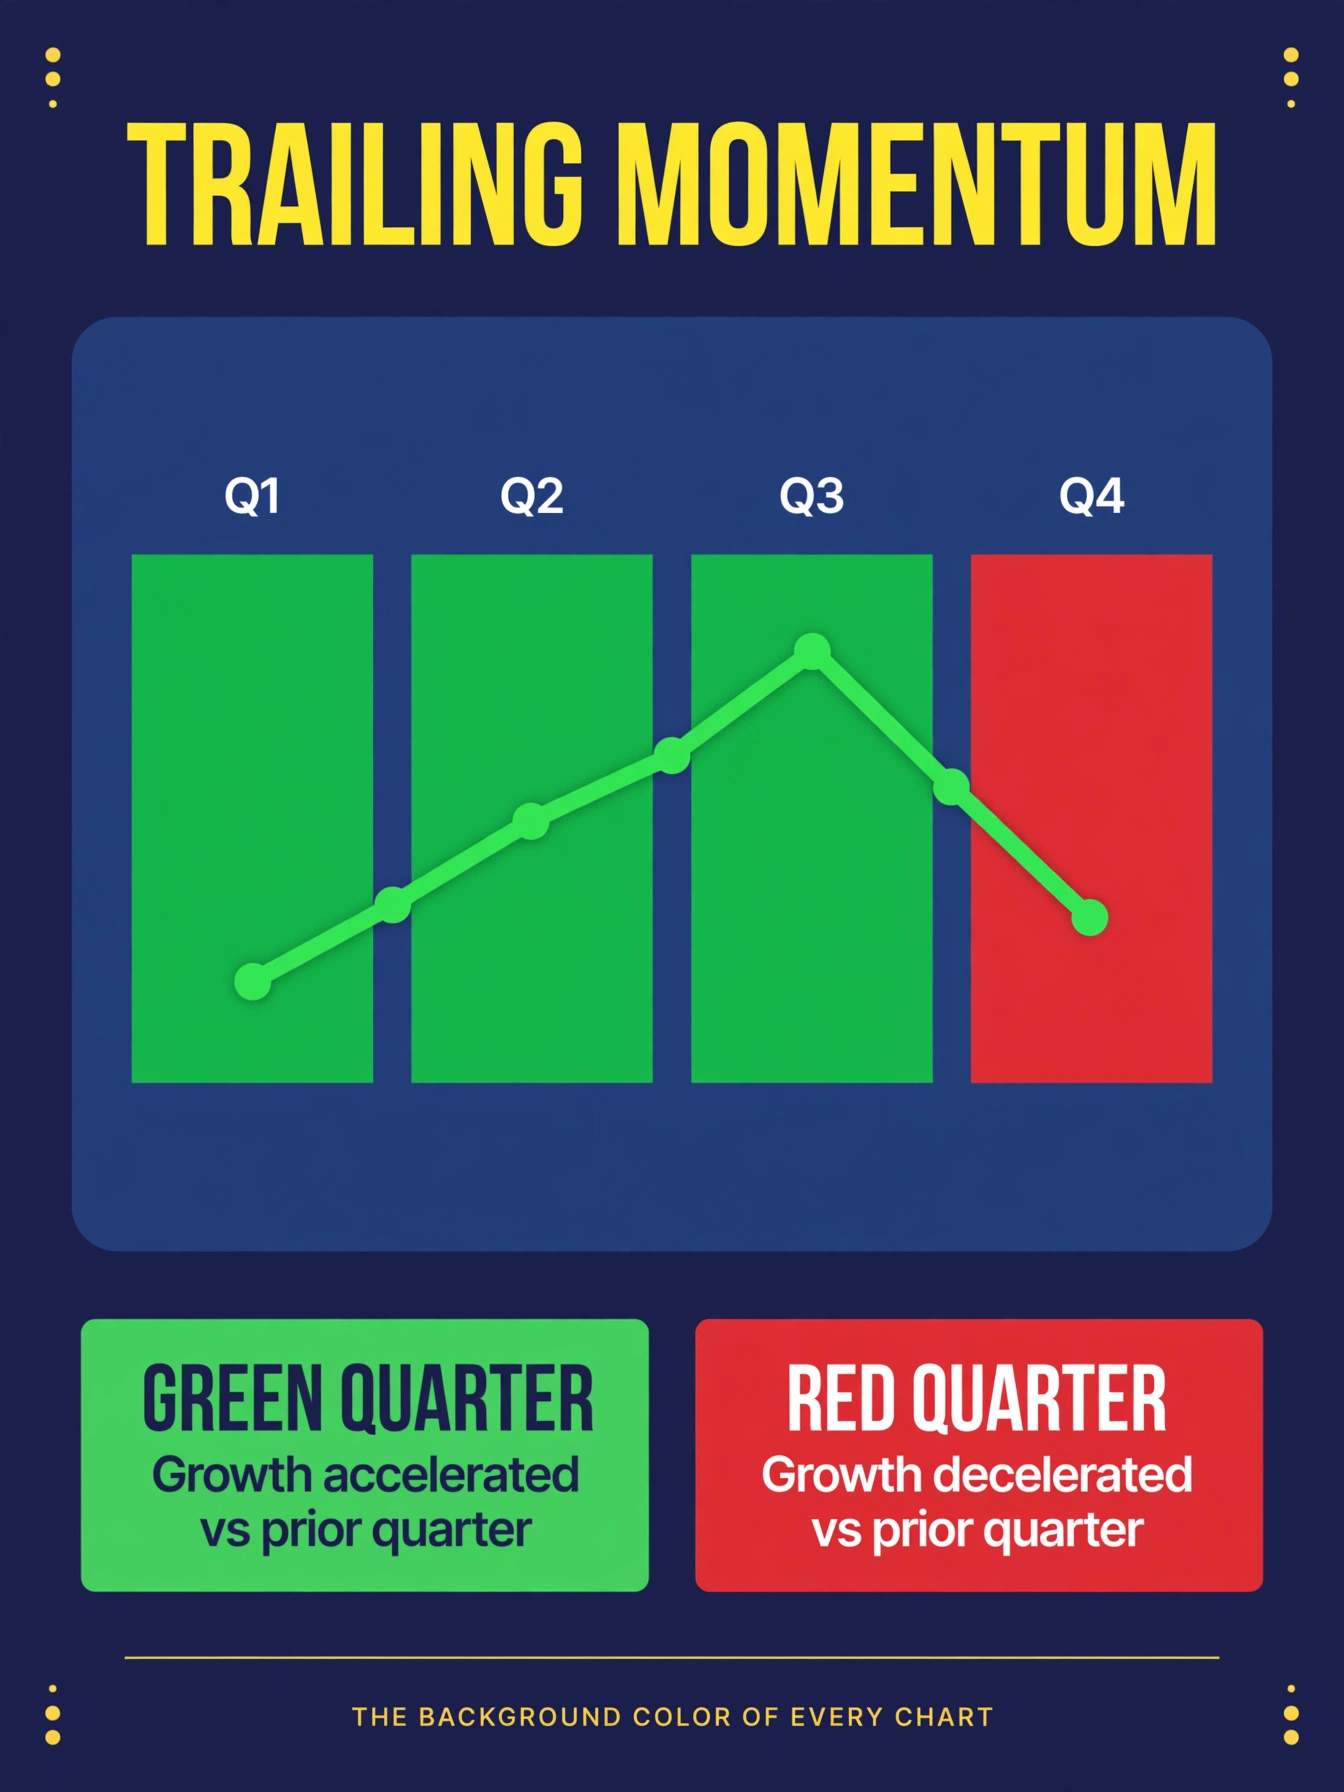
Think of the background as the climate history written into every chart. When you look at "Price vs Trailing EPS" and see price climbing through red quarters, you are watching the market rise while the real earnings engine cools — expectations running ahead of reality. When you see price falling through green quarters, the market is selling something whose fundamentals are still warming — fear running ahead of the facts. The lines tell you what happened; the background tells you what kind of weather it happened in. Read the background first.
Revisions: Expectations Are Alive
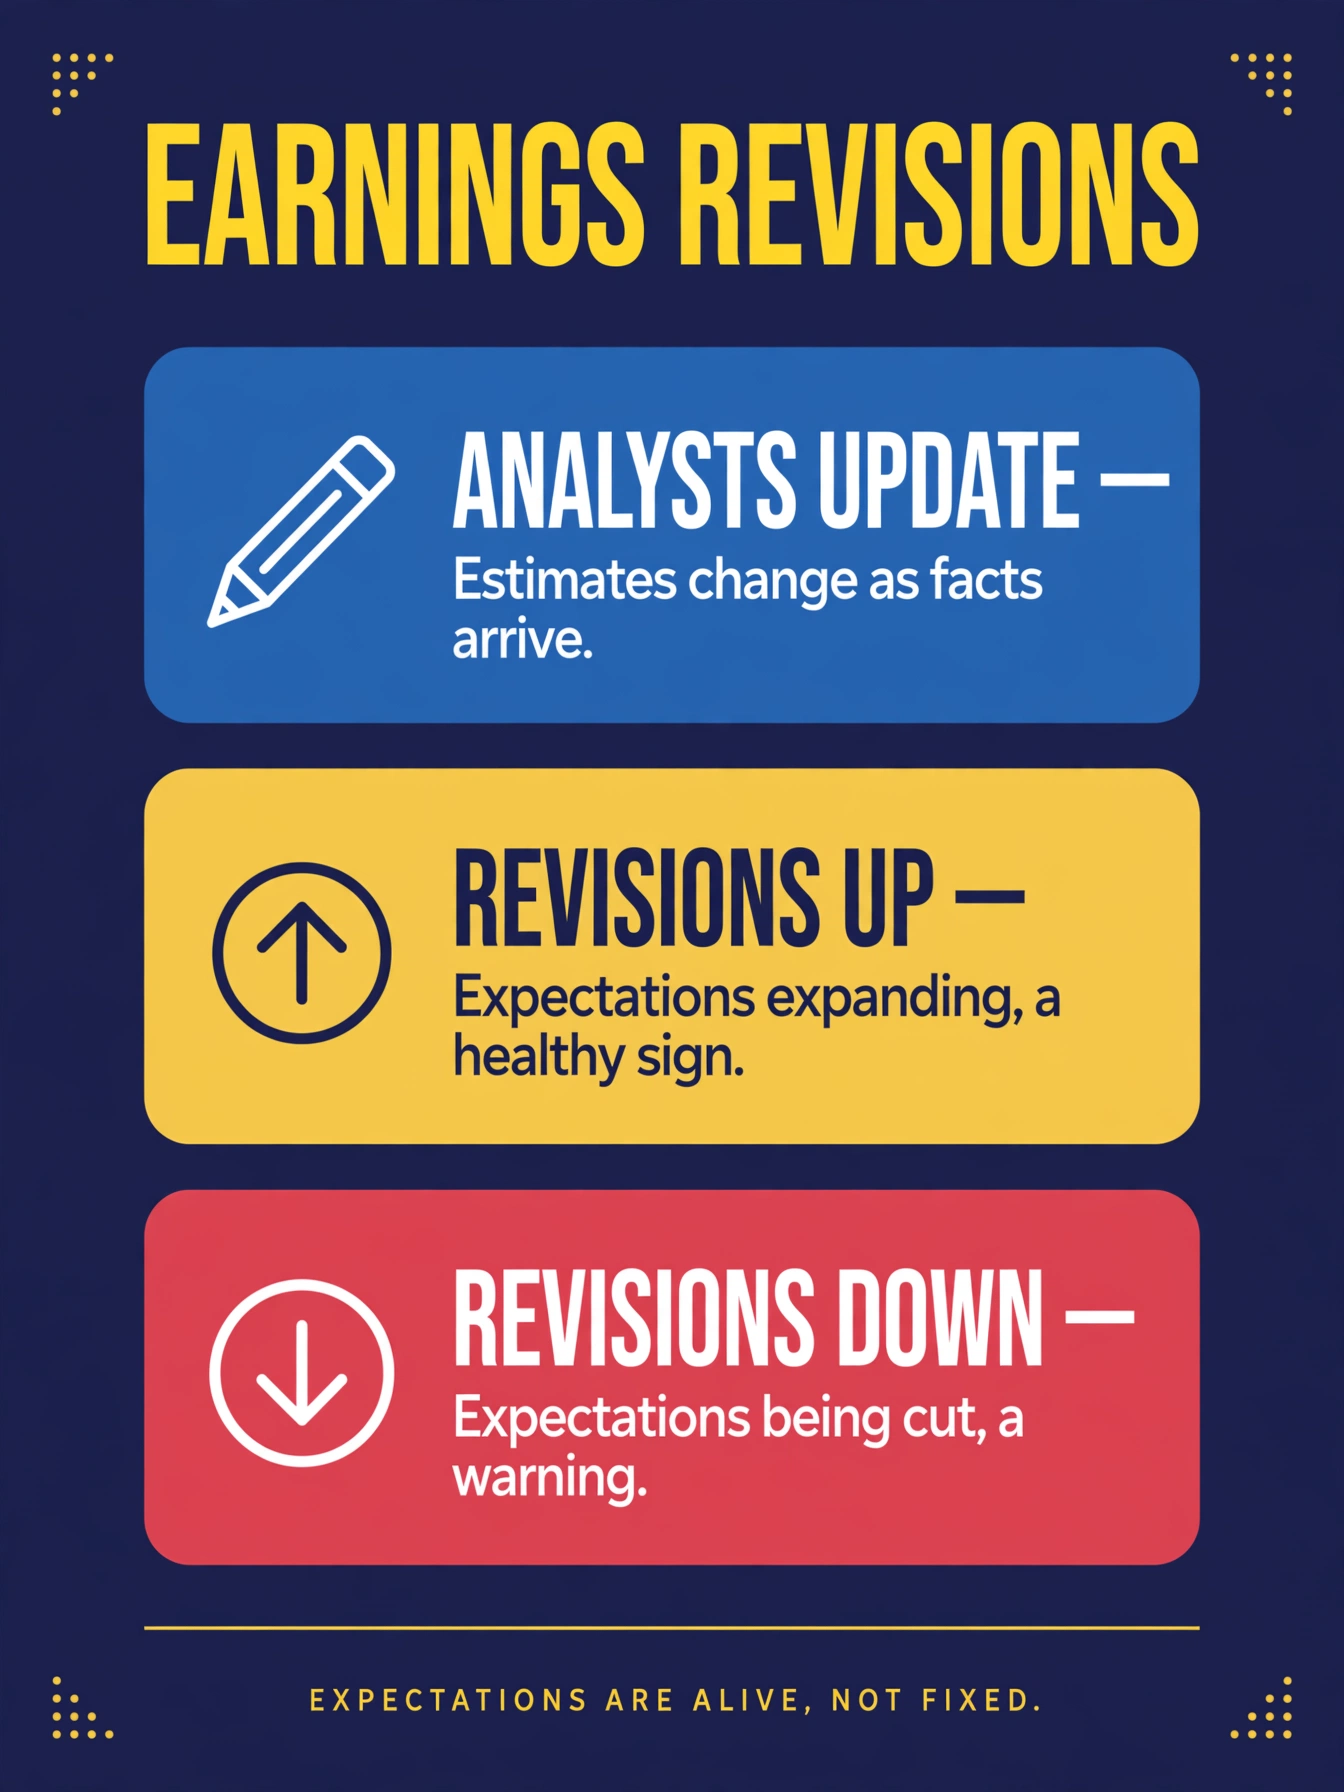
Forward EPS is not carved in stone — analysts revise it constantly, and those revisions are themselves a signal. When companies report strong results and raise guidance, analysts revise estimates up: expectations expanding, a healthy sign. When results disappoint or the economy softens, analysts revise down: expectations being cut, a warning. Light 1 turning yellow is very often the visible footprint of a wave of downward revisions.
Two honesty notes the dashboard practices here. First, one-time items — a giant writedown, a tax windfall, a legal settlement — can distort a quarter's trailing EPS without saying anything about the real business. The dashboard annotates these (like the second quarter of 2026's one-time items) instead of smoothing them away, so you see the bump and the explanation. Second, revisions tend to herd: analysts cut together and raise together, which means expected growth can overreact in both directions. The climate reads the herd's direction without worshipping its precision.
Why Both Halves Matter
Now put the halves together, because this is the move the whole framework is built around. Compare Light 1 (what the market expects) with Light 2 (what companies actually delivered):
- Both green: expectations expanding and reality accelerating — the healthiest climate, hopes confirmed by results.
- Expectations green, reality yellow: the market is priced for growth that actual earnings are not delivering — the classic late-cycle warning, and exactly the disagreement the dashboard was built to surface.
- Both yellow: expectations being cut and reality decelerating — the climate is cold; caution, smaller size, protection.
- Expectations yellow, reality green: the market has stopped believing, but actual earnings are still accelerating — pessimism running ahead of the facts, which is often where opportunity quietly forms.
No single combination is a buy or sell signal — the dashboard is a weather report, not a trade trigger, and Luke does not use it to time entries. But knowing which of the four weathers you are standing in changes everything about how much risk you carry into it. That is the subject of MC-205.
Key terms
- Trailing EPS
- earnings per share actually reported over the last twelve months; the rearview mirror, real money already earned.
- TTM
- trailing twelve months; the standard window for "what already happened" earnings.
- Forward EPS
- the estimated earnings over the next twelve months; the windshield, a forecast that moves weekly.
- Quarter-over-quarter (QoQ)
- this quarter's value versus last quarter's; the rhythm the trailing light reads on.
- Trailing-EPS momentum
- whether the quarterly growth rate in trailing EPS accelerated or decelerated versus the prior quarter; the rule behind every chart's background color.
- Earnings revision
- analysts updating their forward estimates as new facts arrive; revisions up expand expectations, revisions down cut them.
- One-time item
- a non-recurring event (writedown, windfall, settlement) that distorts a quarter's earnings; the dashboard annotates these instead of smoothing them.
What's next
You now hold both halves of the climate — hopes and reality. MC-204 "Valuation Context" adds the third dimension: price. What does it mean when the market pays more for each dollar of expected earnings, and what happens when it starts paying less?
The quiz
Trailing and Forward EPS — Quiz
3 questions · pass with 3 correct
1.What is the difference between trailing EPS and forward EPS?
2.What does a red quarter in a chart's background mean?
3.How does the dashboard handle one-time items that distort a quarter's earnings?