
Valuation Context
School 06 — Market Climate Lab
School 6 · Market Climate Lab · About 15 minutes
You know what the market expects (forward EPS) and what companies actually earned (trailing EPS). Now add the third character in the story: the price investors are paying. The relationship between price and expected earnings — the forward P/E — is the valuation context around everything the climate indicator reads. It answers a simple question: for each dollar of earnings the market expects, how many dollars is it charging you? And when that answer stretches or shrinks, it tells you whether the market's mood — not just its math — is changing.
The Price of a Dollar of Earnings
The forward P/E is one division problem: the market's price divided by forward EPS — what you pay divided by what you are expected to get. Take the example on the chart: a price of 500 and forward EPS of 25 gives a forward P/E of 20. Read it plainly: investors are paying $20 for every $1 of earnings they expect over the next year — roughly twenty years of expected earnings to buy the whole stream.
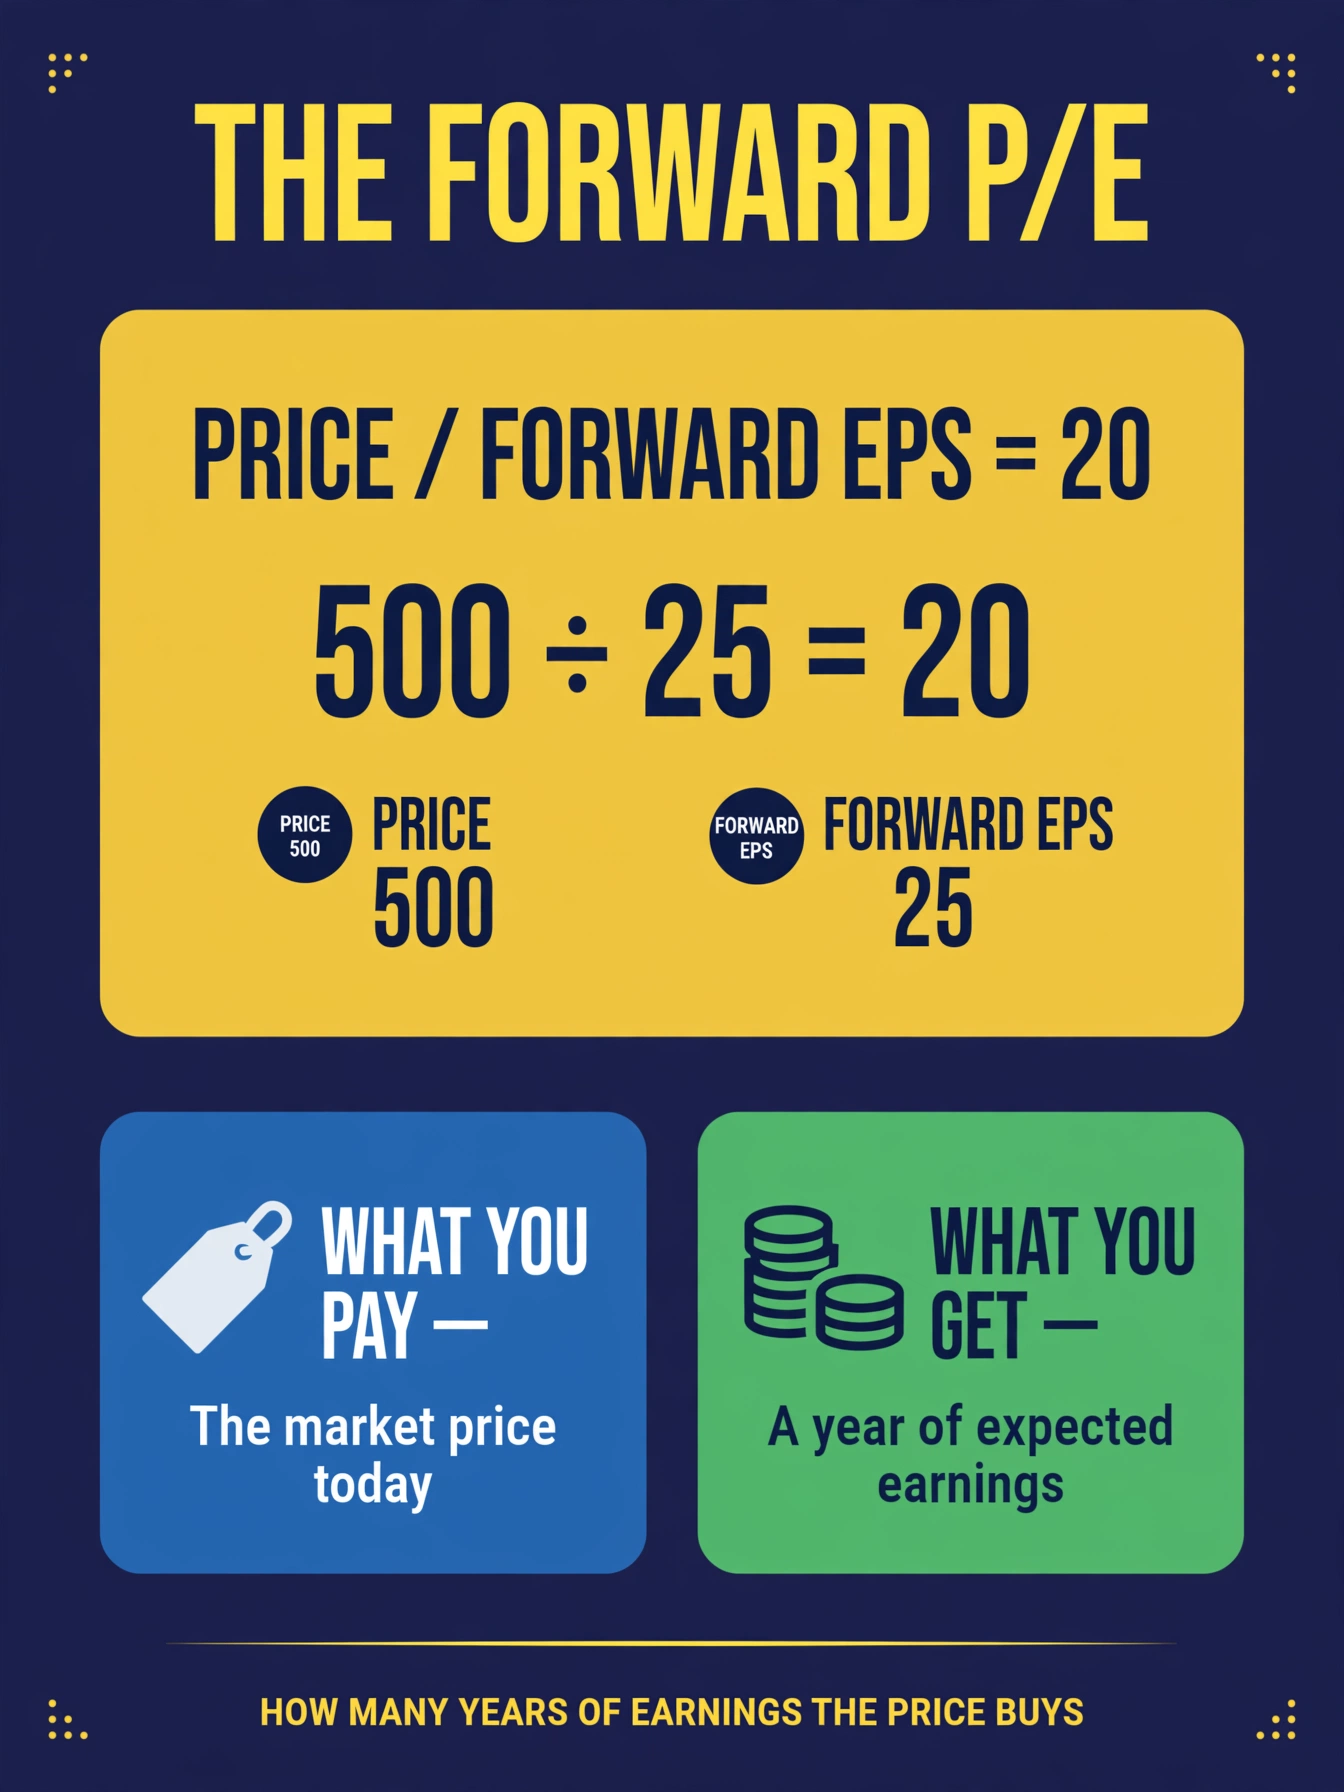
Notice what the ratio connects: the numerator is price (Light 3's territory — fast, emotional, daily) and the denominator is forward EPS (Light 1's territory — slow, analytical, weekly). The forward P/E is where those two worlds meet. When the ratio rises, investors are paying more for the same expected earnings — enthusiasm is doing the lifting. When it falls, they are paying less — caution is doing the discounting. Same earnings, different mood, different price.
One grounding note, because this school is careful about what is Luke's and what is general: Luke's three self-researched metrics are expected earnings growth, trailing EPS, and forward EPS. The forward P/E is a standard valuation concept — you met P/E back in AP-204 — that we use here as context for reading those three metrics against price. It is a lens, not a fourth proprietary input.
The Same Price, Two Stories
Here is why valuation context matters for the climate read. Imagine the market rises 10% in a year. There are two completely different ways that can happen:
- Story one: forward EPS also rose about 10%. The forward P/E barely moved. The market paid more because it expects more — earnings did the work, price followed. Healthy.
- Story two: forward EPS barely moved, and the forward P/E stretched from, say, 18 to 20. The market paid more for the same expected earnings — enthusiasm did the work, earnings watched. Fragile.
Both stories show the same rising price chart. Only the valuation context tells them apart — and only one of them is supported by the fundamentals the climate indicator tracks. This is the "priced for versus actually earned" question from MC-201, now with a number attached.
Multiple Expansion and Compression
The stretching and shrinking have names. Multiple expansion is when investors pay more per dollar of earnings — the P/E rises because enthusiasm outruns the numbers. Multiple compression is the reverse: investors pay less per dollar of earnings — the P/E falls because caution discounts the numbers.
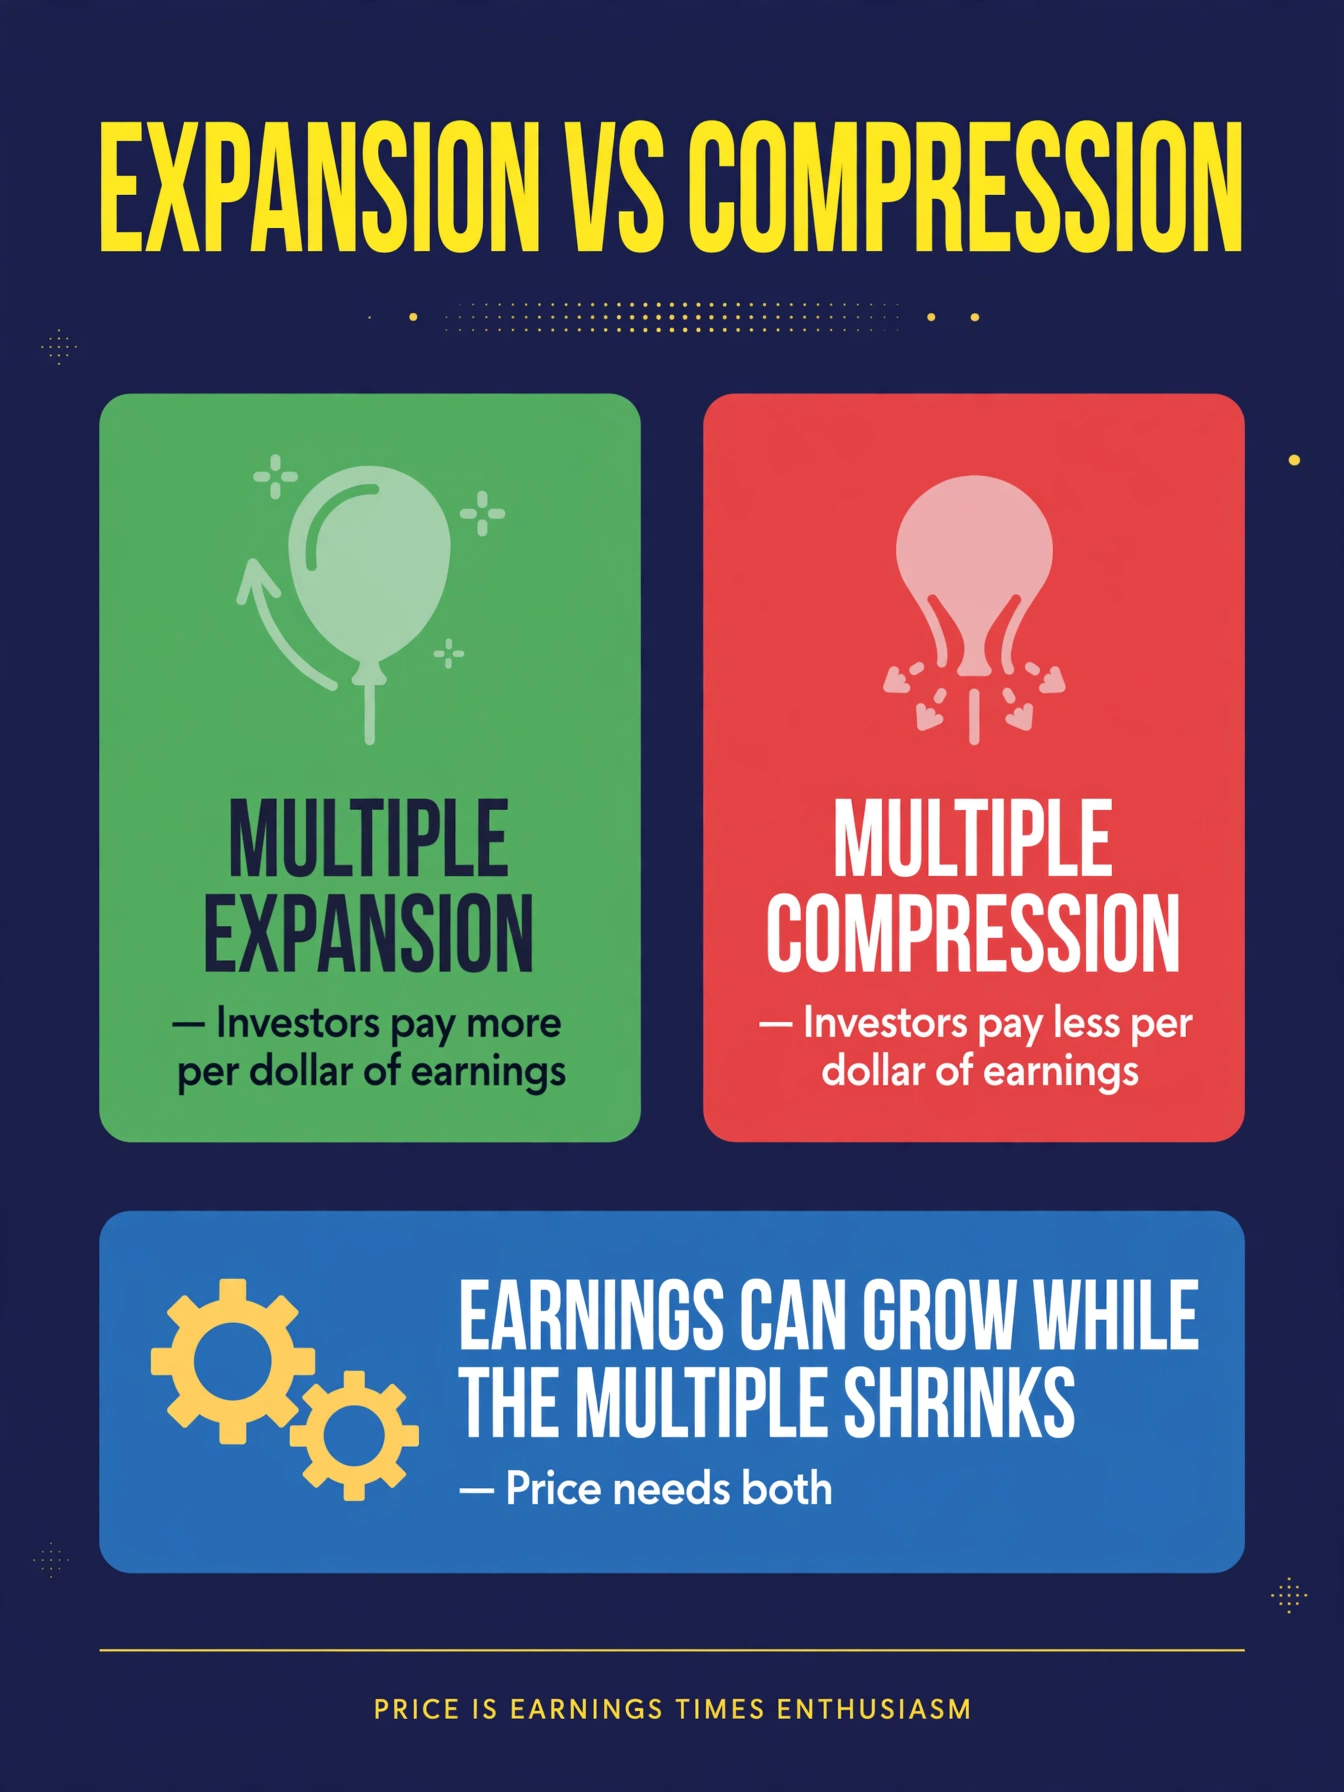
And here is the twist that surprises beginners: earnings can grow while the multiple shrinks. A company can earn more each year while investors, growing nervous, pay fewer dollars per dollar of those earnings — the stock goes sideways or down on rising profits. Price needs both engines: growing earnings and a willing multiple. The climate indicator watches the earnings engine; the forward P/E tells you what the enthusiasm engine is doing. When you see green earnings lights but a compressing multiple, you are watching the market refuse to pay up for good news — often the earliest sign that the mood is turning before the data is.
The Gap Is the Climate
Bring it all together and you get the dashboard's central image: a scale with what the market is priced for on one side and what companies actually earned on the other. When expectations run ahead of reality, the priced-for side sits heavy — the market is paying for a future that has not arrived. Eventually one of two things happens: earnings catch up to the price, or the price comes back to earnings. The gap between the pans is the climate.
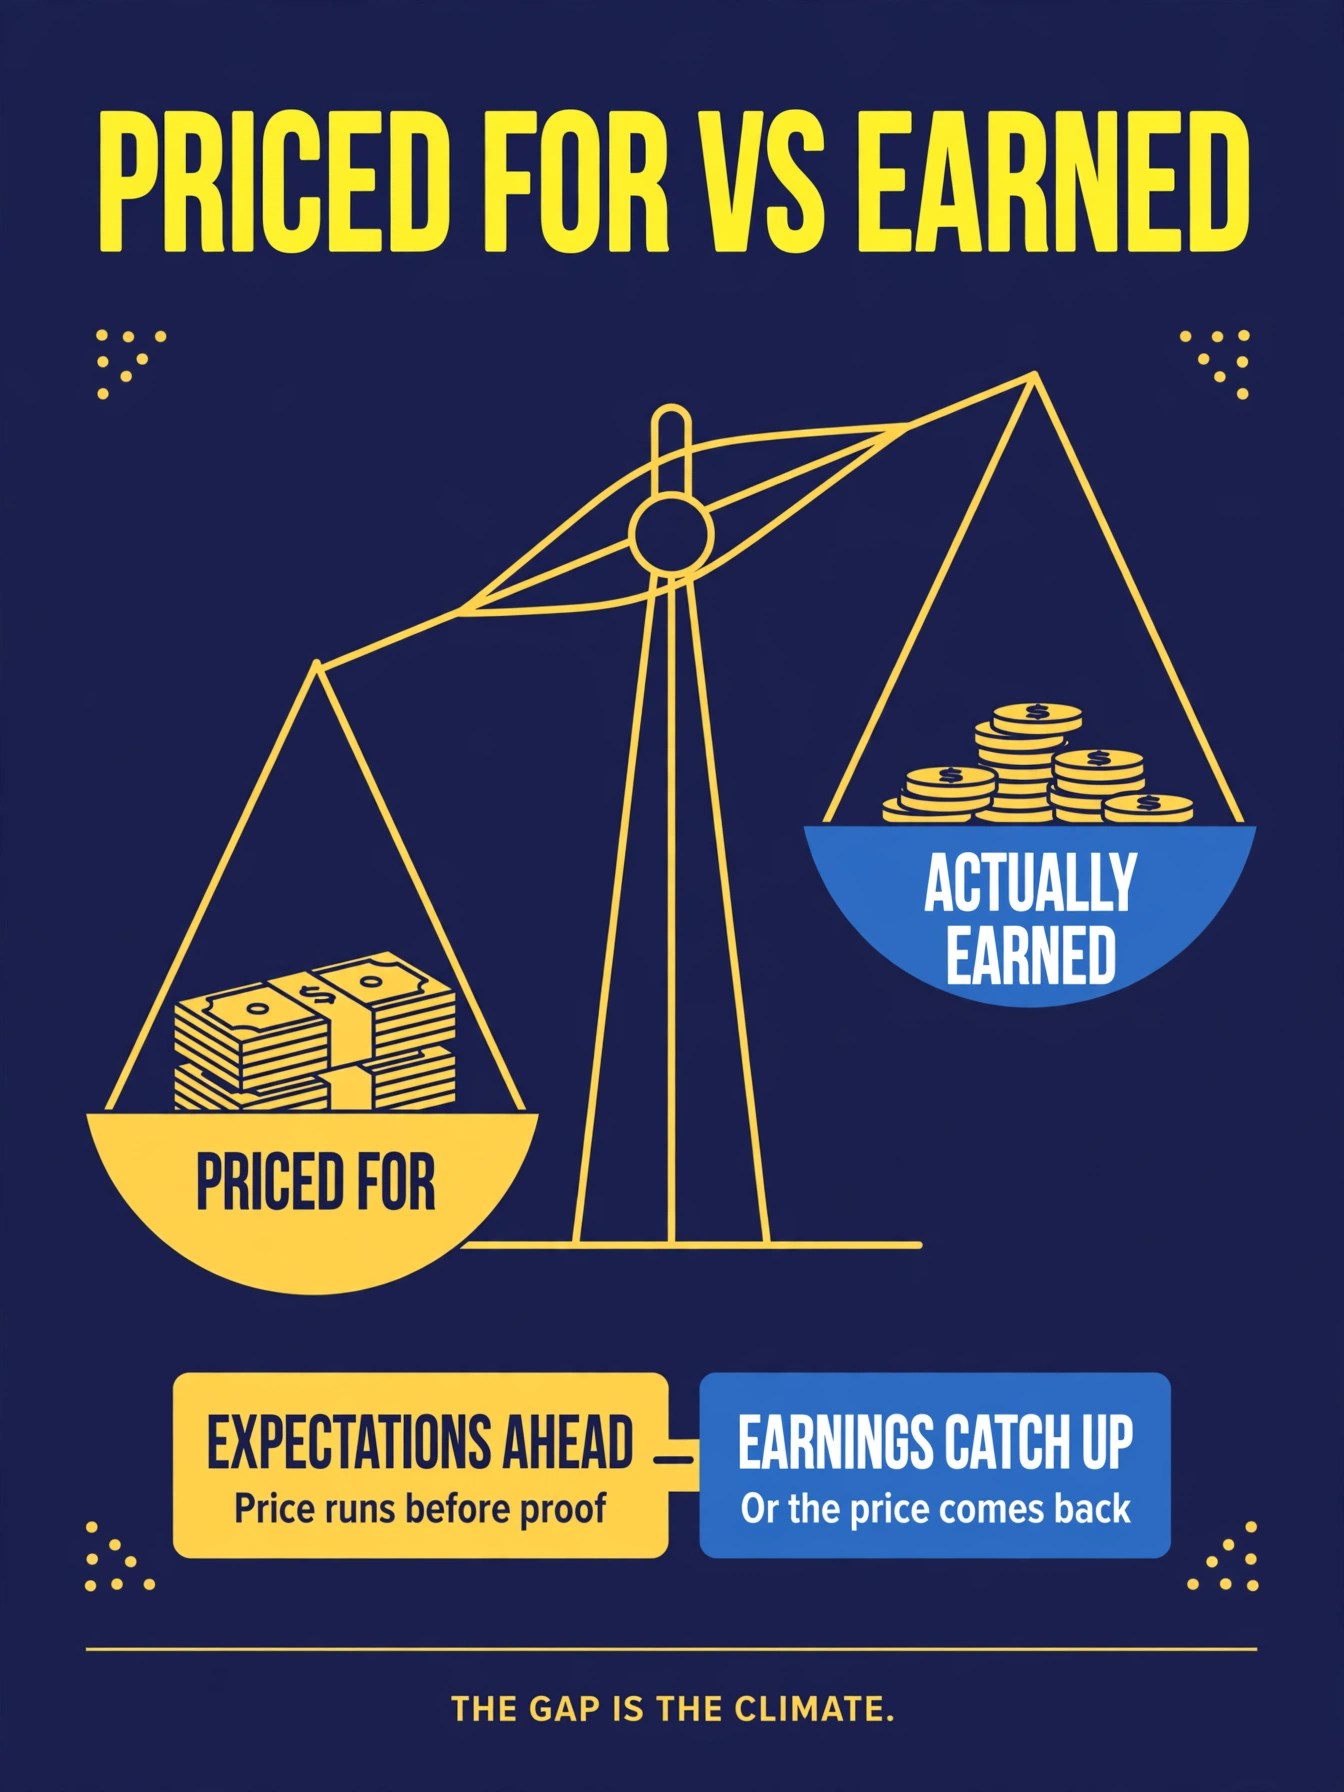
A wide gap with warm earnings is a market running on hope — enjoyable until hope needs receipts. A wide gap with cooling earnings is the warning the whole framework exists to deliver. A narrow gap is a market and its fundamentals in agreement — the calmest weather there is. None of this is a signal to trade; it is context for how much risk the weather justifies carrying. Sizing risk to the weather is the entire subject of the next class.
One open question to carry forward honestly: exactly how valuation context feeds into the formal climate read — the precise role of the forward P/E alongside Luke's three core metrics — is part of the proprietary construction that this Academy course does not document. We teach the concept and the context; the indicator's internal recipe is Luke's. If you want it specified further, that is a question for him, and we have flagged it as such.
Key terms
- Forward P/E
- price divided by forward EPS; how many dollars investors pay for each dollar of expected next-twelve-month earnings (e.g., 500 ÷ 25 = 20).
- Multiple
- shorthand for the P/E ratio; the market's enthusiasm expressed as a number.
- Multiple expansion
- investors paying more per dollar of earnings; the P/E stretches on enthusiasm.
- Multiple compression
- investors paying less per dollar of earnings; the P/E shrinks on caution, even if earnings grow.
- Priced-for vs earned
- the gap between what the market's price assumes and what companies actually delivered; the central image of the climate read.
- Valuation context
- reading price against expected earnings so you can tell whether a rising market is powered by earnings or by enthusiasm.
What's next
You can now read the weather in full — expectations, reality, and price. MC-205 "Climate-Based Risk Posture" turns the read into action: when the climate says lean in, when it says back off, and the honest limits of what slow fundamental data can tell you.
The quiz
Valuation Context — Quiz
4 questions · pass with 3 correct
1.A market is priced at 500 with forward EPS of 25. What is its forward P/E?
2.What does a forward P/E of 20 mean in plain English?
3.What is multiple compression?
4.A company's earnings grew, but its stock price fell. What can explain this?